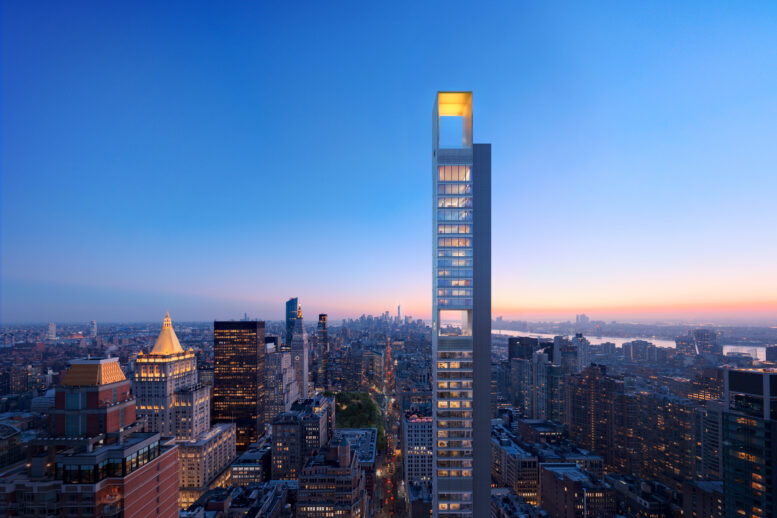
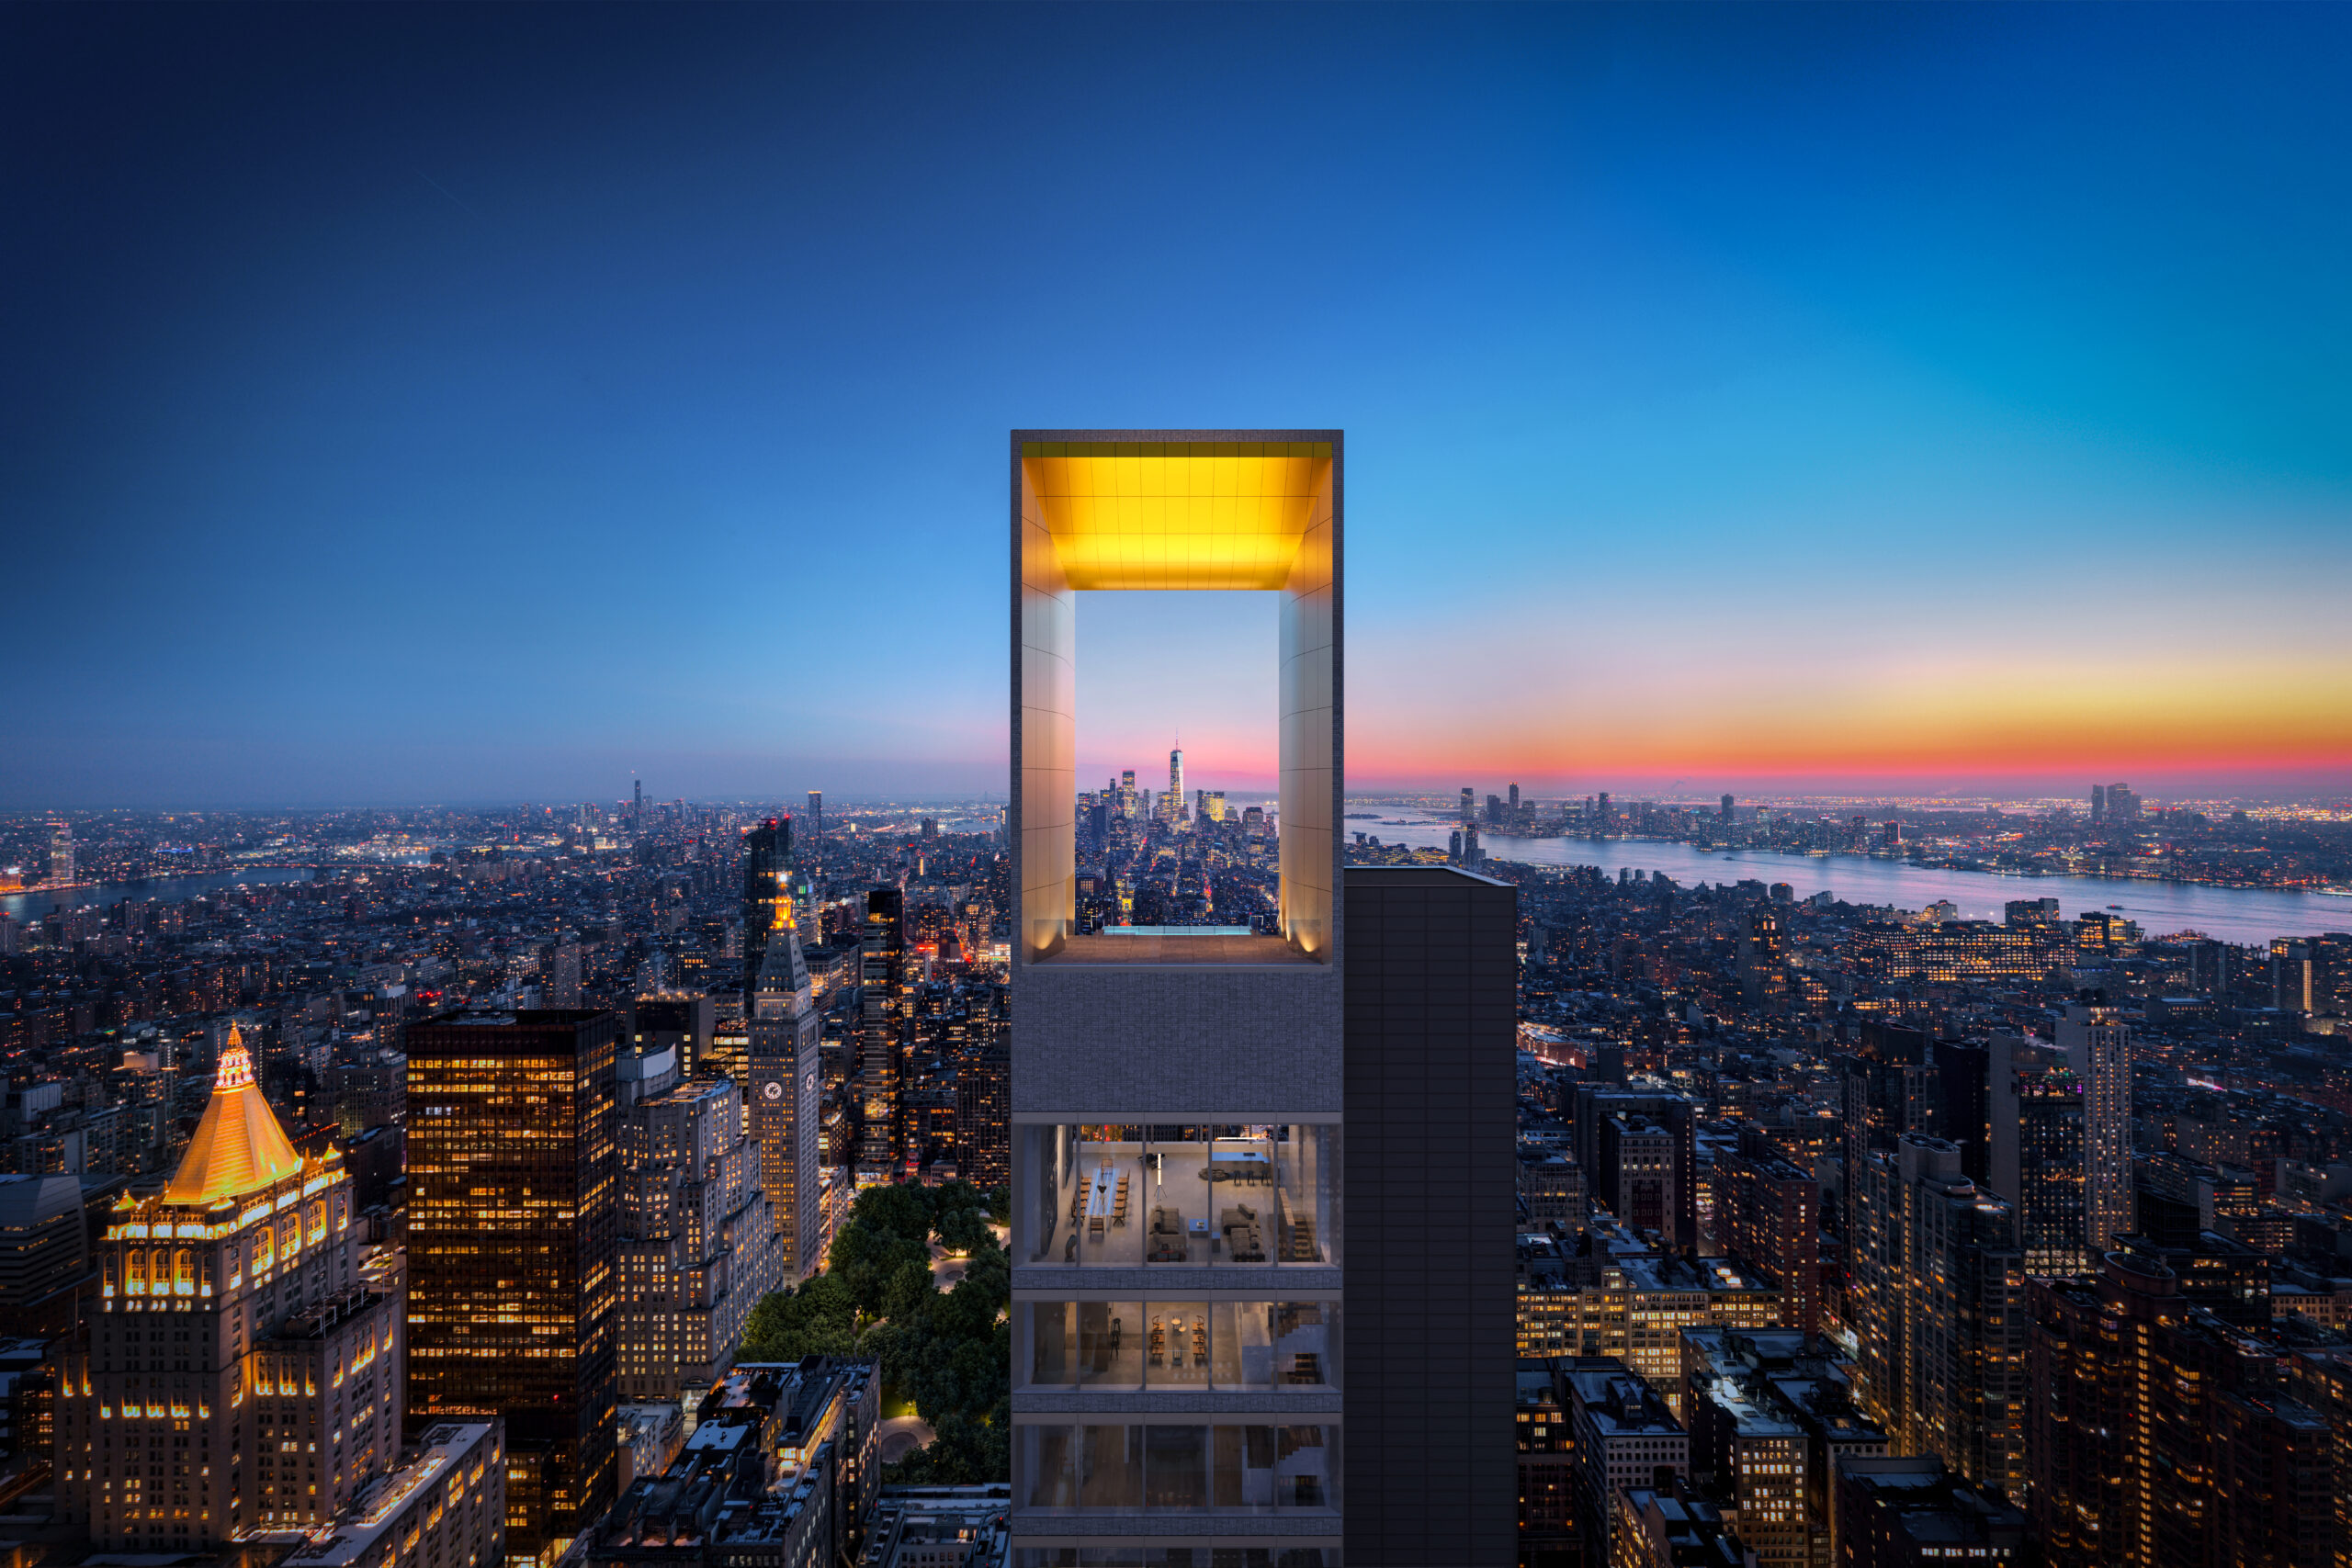
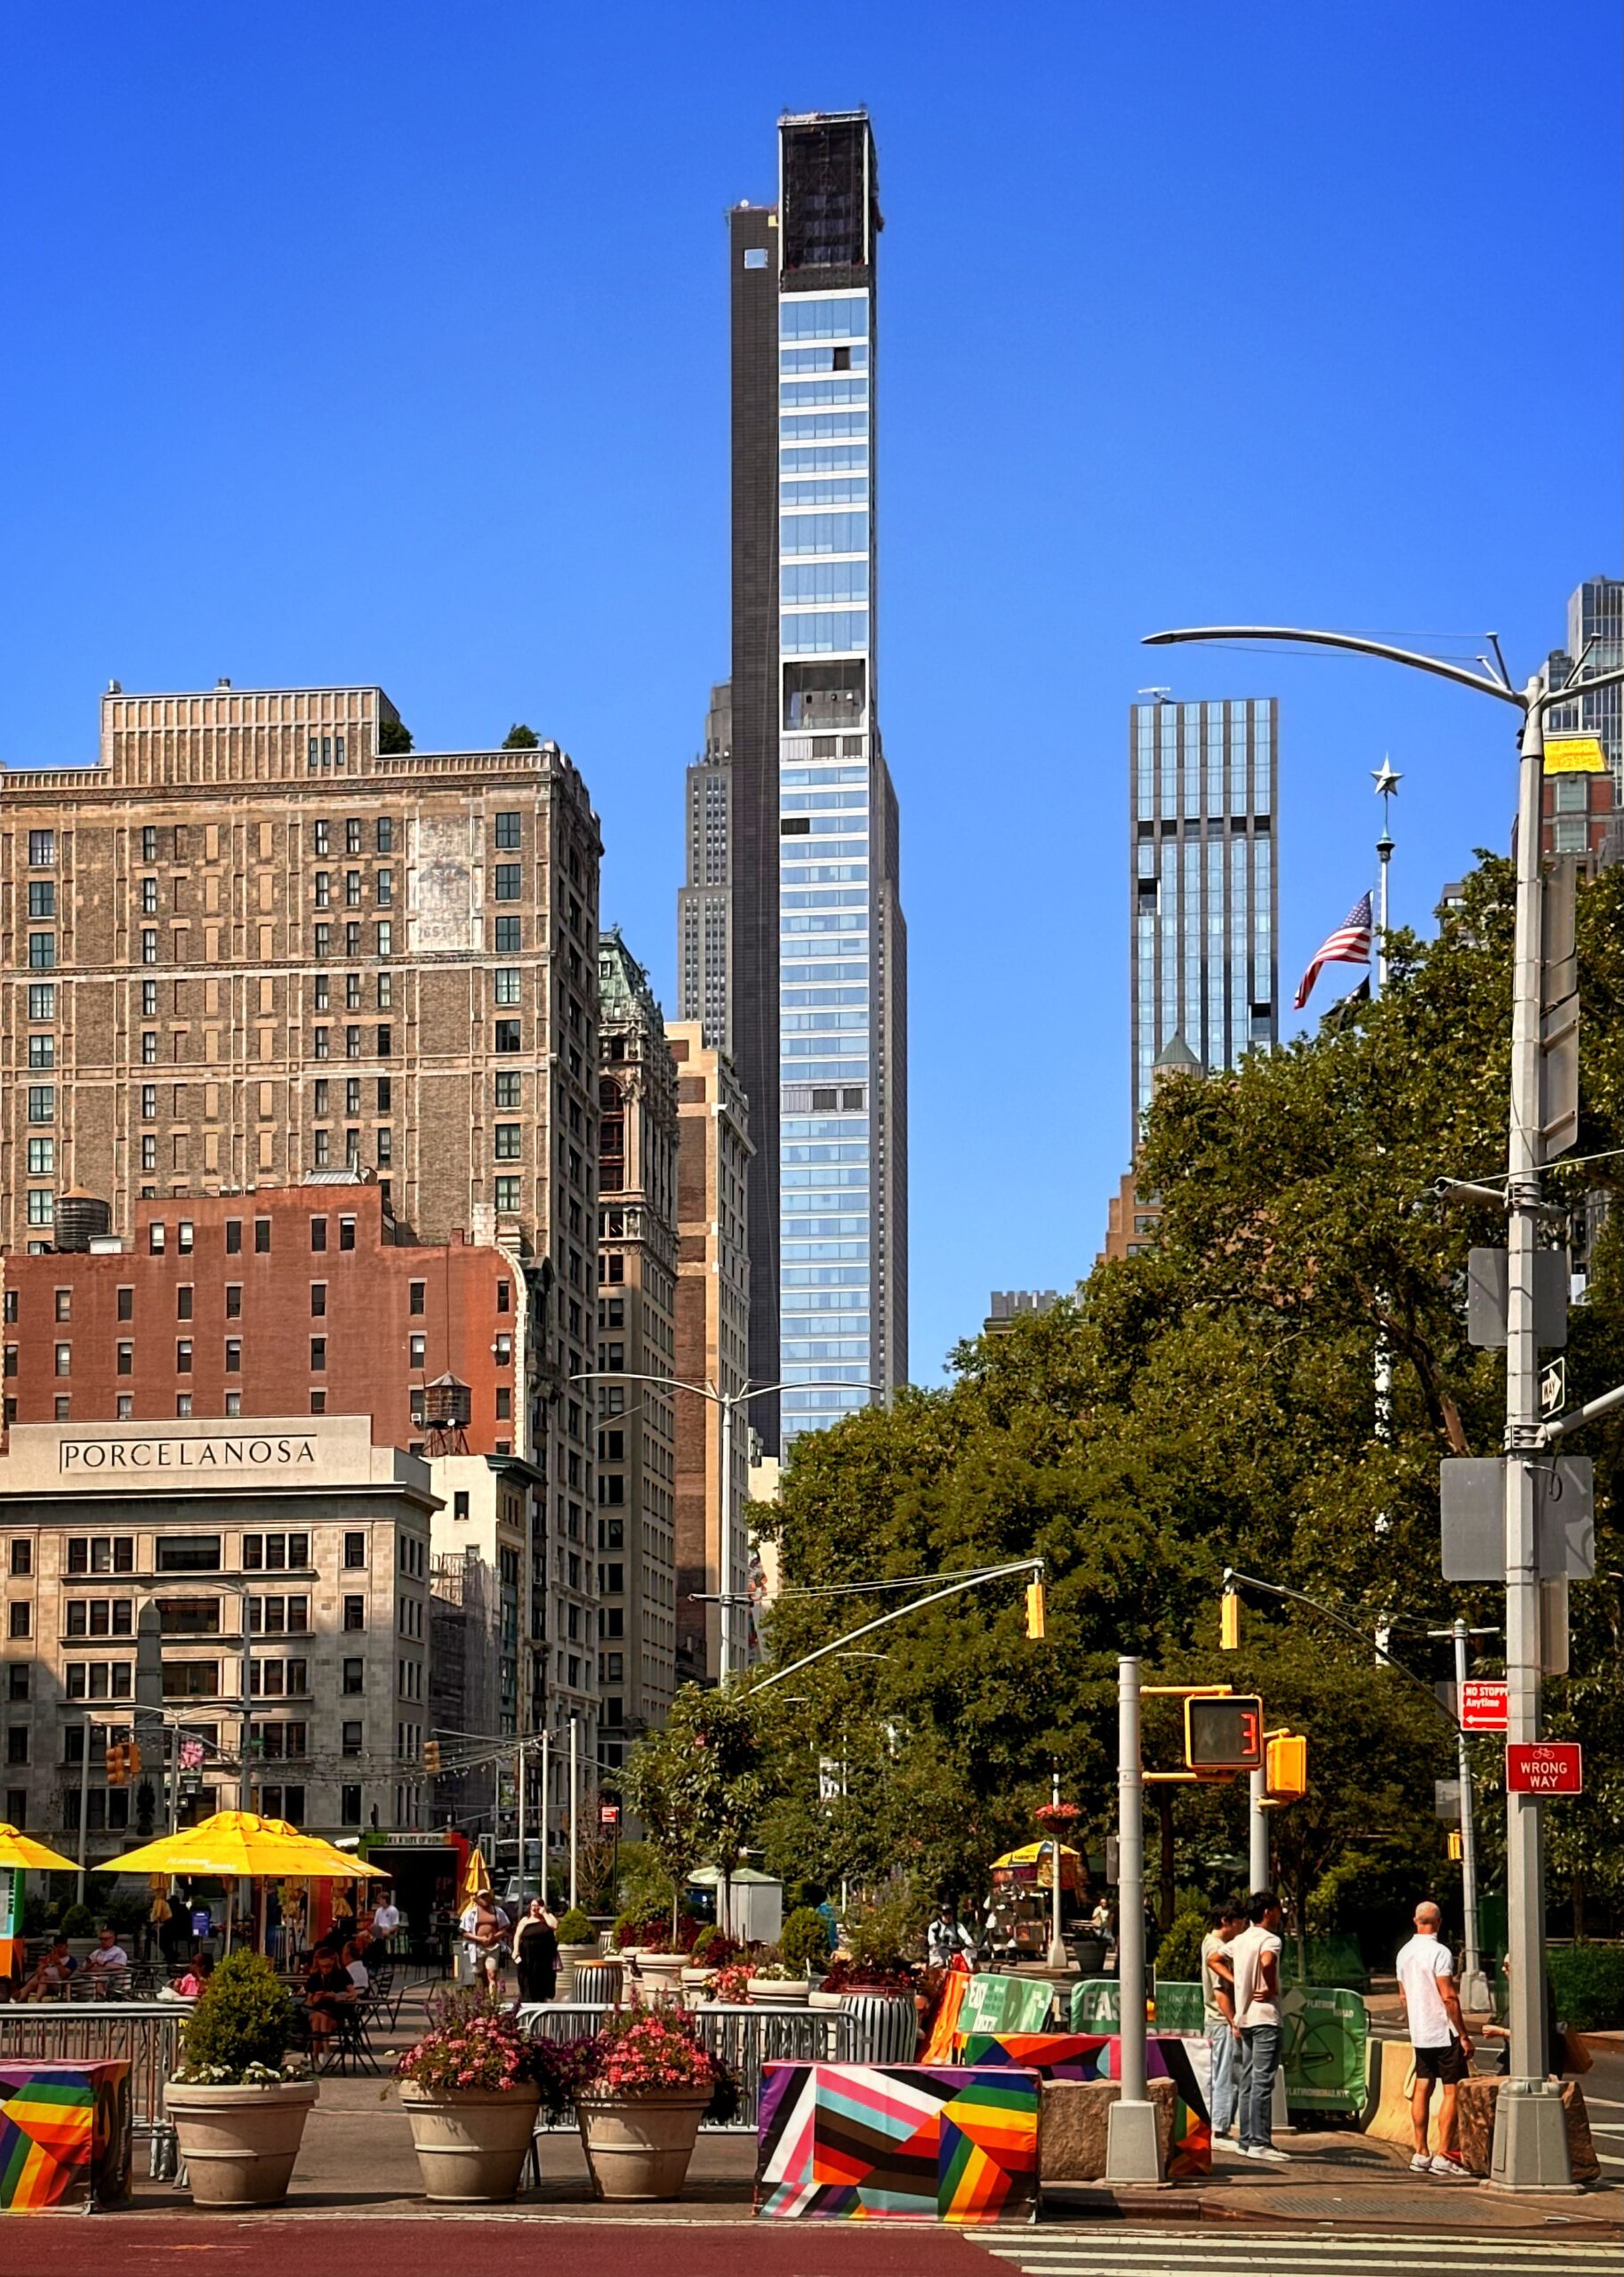
YIMBY has obtained exclusive new renderings of 262 Fifth Avenue, a 52-story residential skyscraper under construction in NoMad, Manhattan. Designed by Meganom and developed by Boris Kuzinez of Five Points Development, the 860-foot-tall structure will yield 26 full-floor and duplex condominium units with an average scope of 3,200 square feet, including at least one quadruplex unit. SLCE Architects is the executive architect for the property, which is located at the southwest corner of Fifth Avenue and West 29th Street.
The above and below renderings look south at the tower at dusk, showcasing the views of Lower Manhattan from the upper levels. The second image offers an updated perspective of the illuminated crown. The soaring rectangular frame will be clad in concave gold paneling above the private penthouse terrace, which will come with an outdoor swimming pool.
The crown of 262 Fifth Avenue. Rendering courtesy of Hayes Davidson.
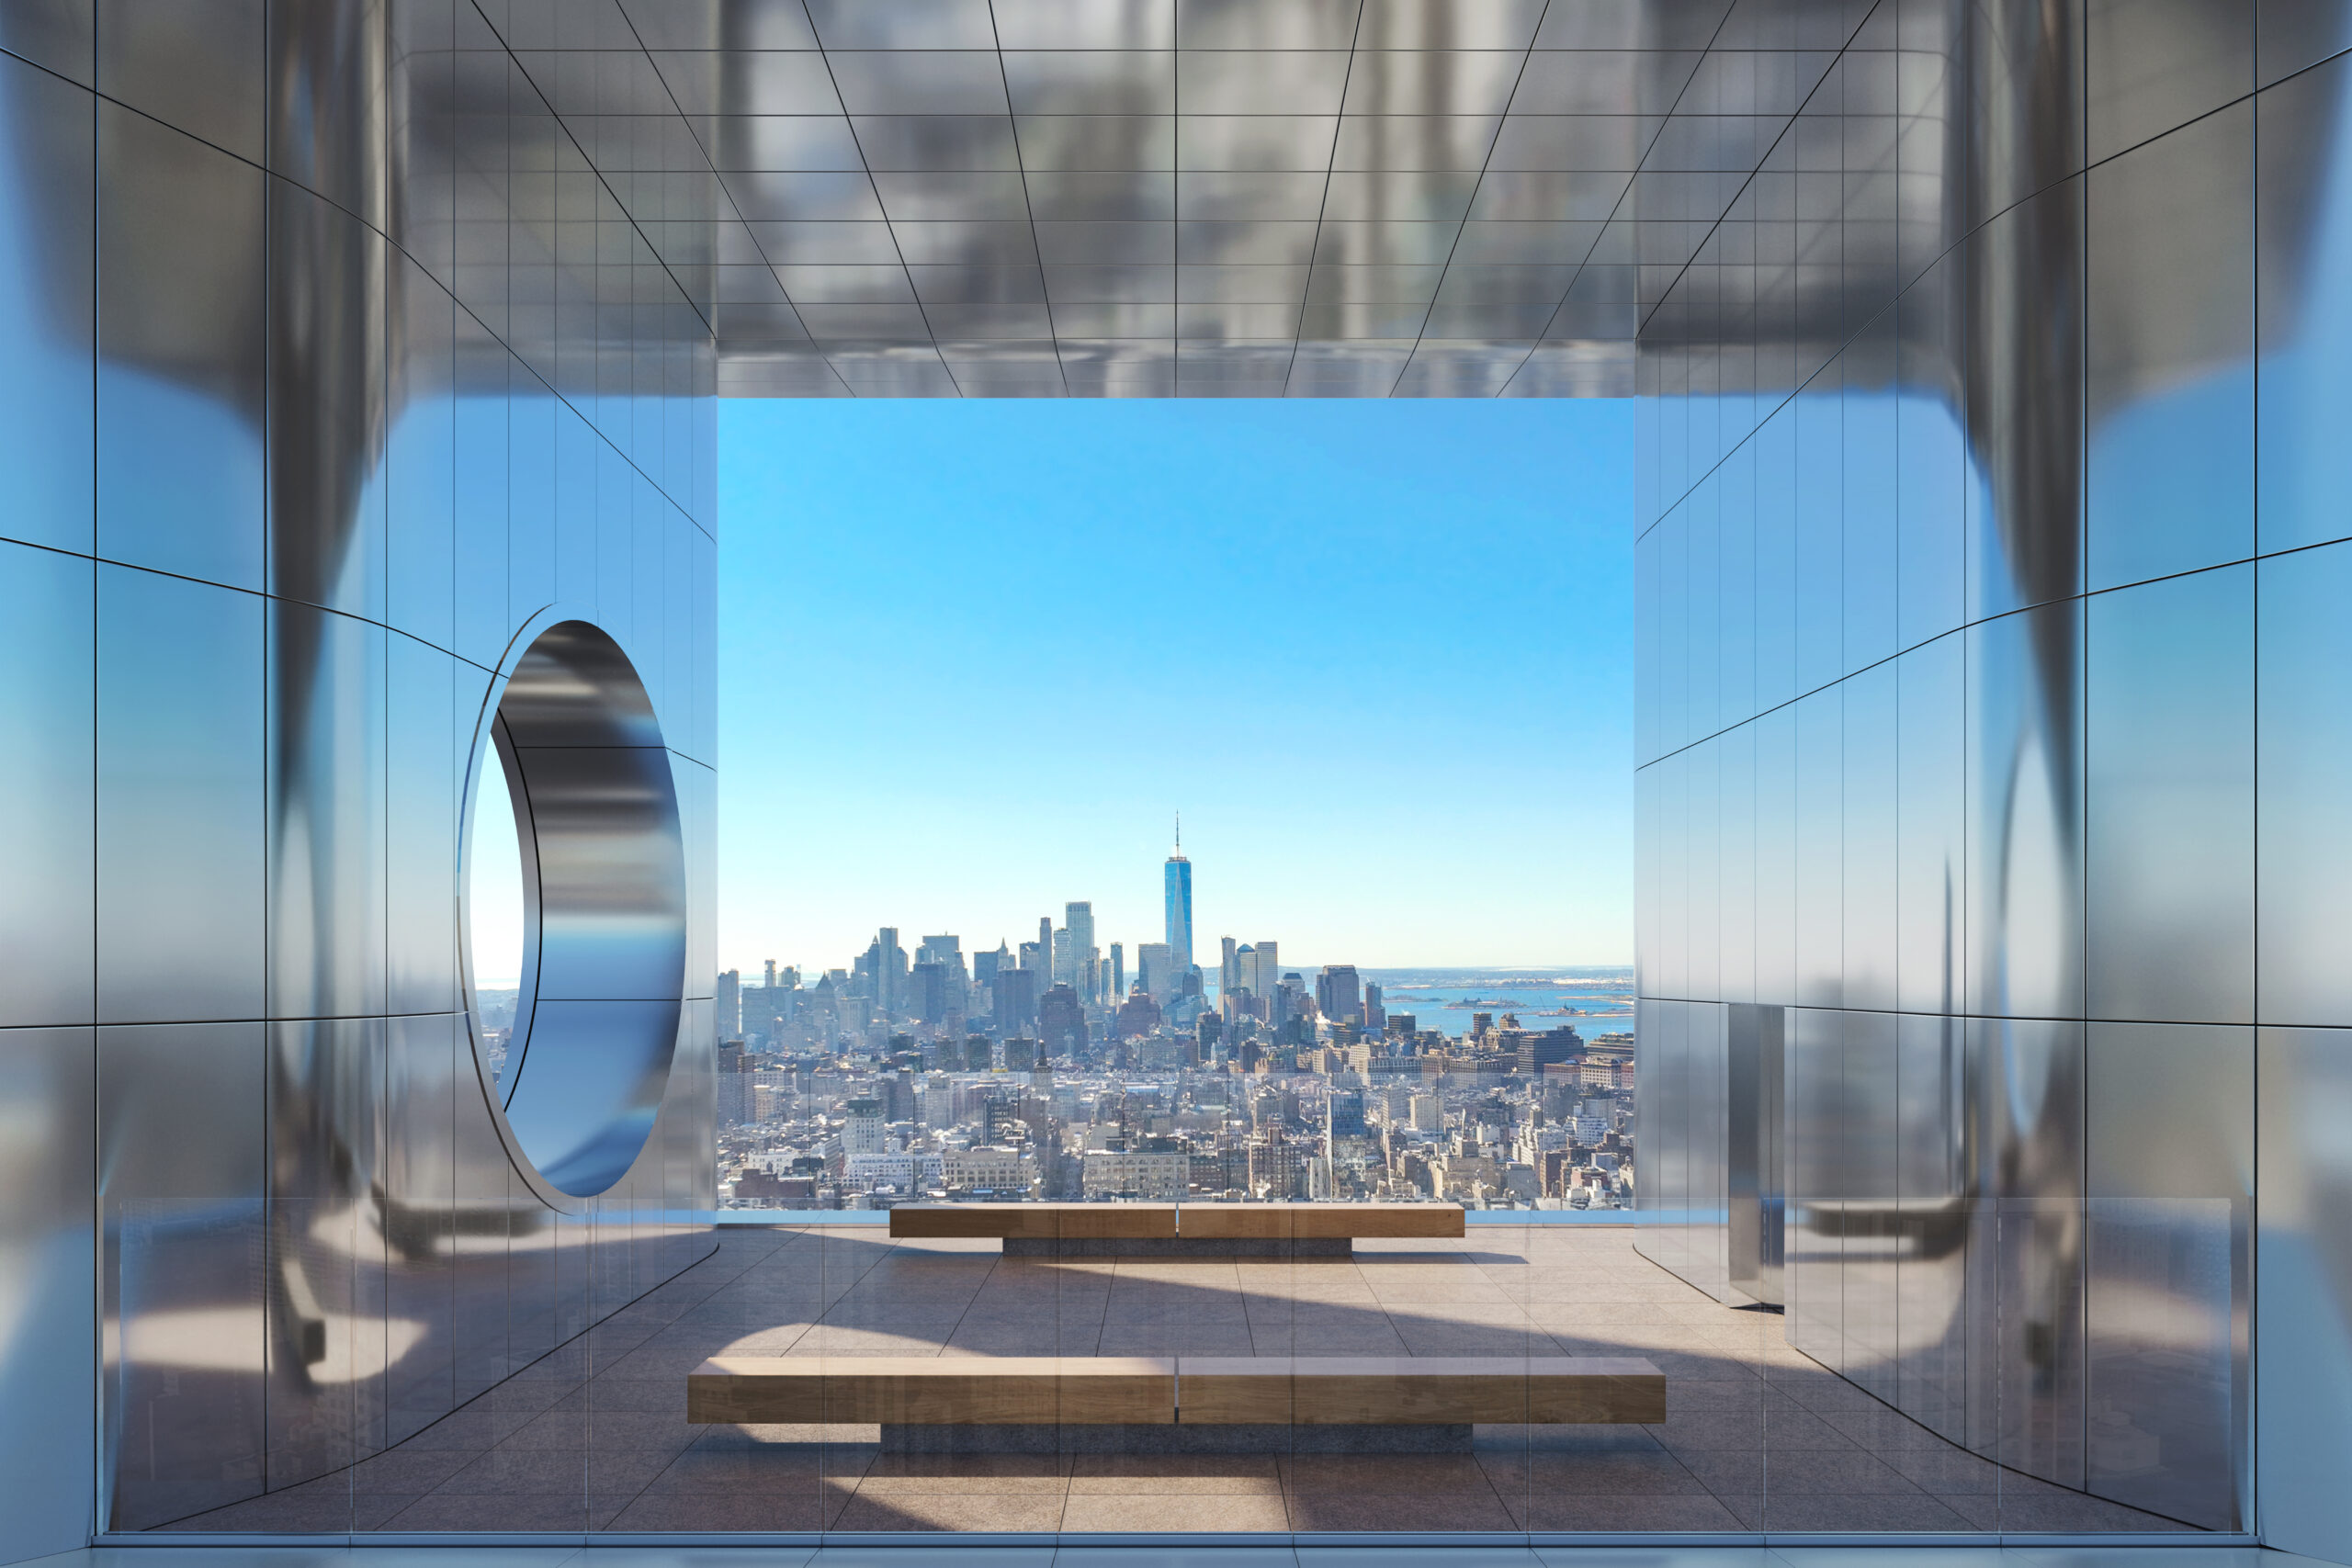
The following new rendering previews the midpoint open-air cutout, which will serve as a communal terrace. The northern and southern ends will be lined with glass railings for unobstructed skyline views, while the side walls and ceiling will be clad in reflective aluminum paneling.
The communal loggia space. Rendering courtesy of Hayes Davidson.
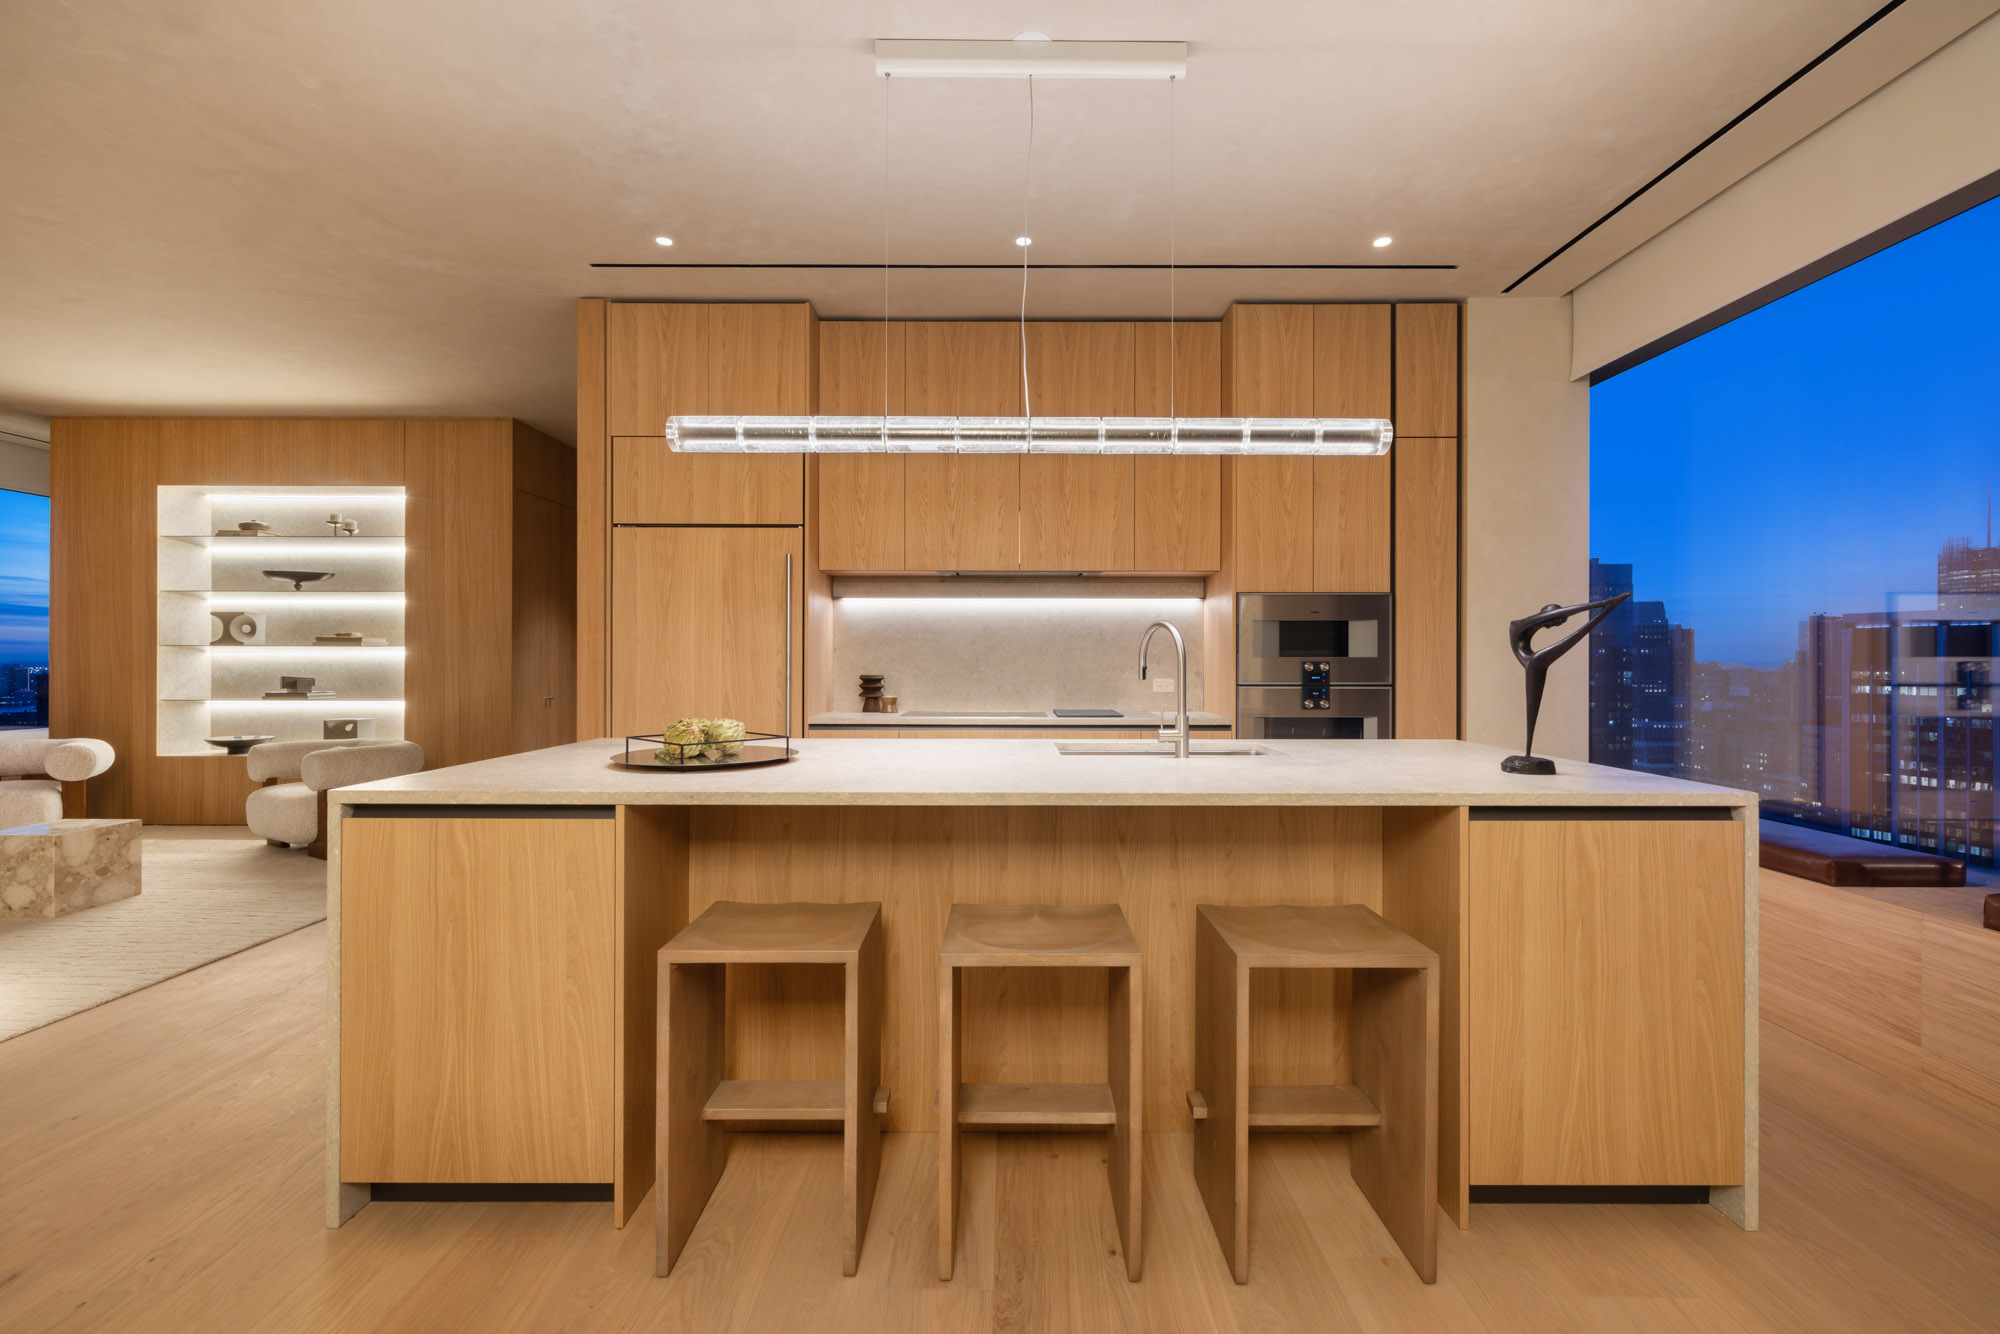
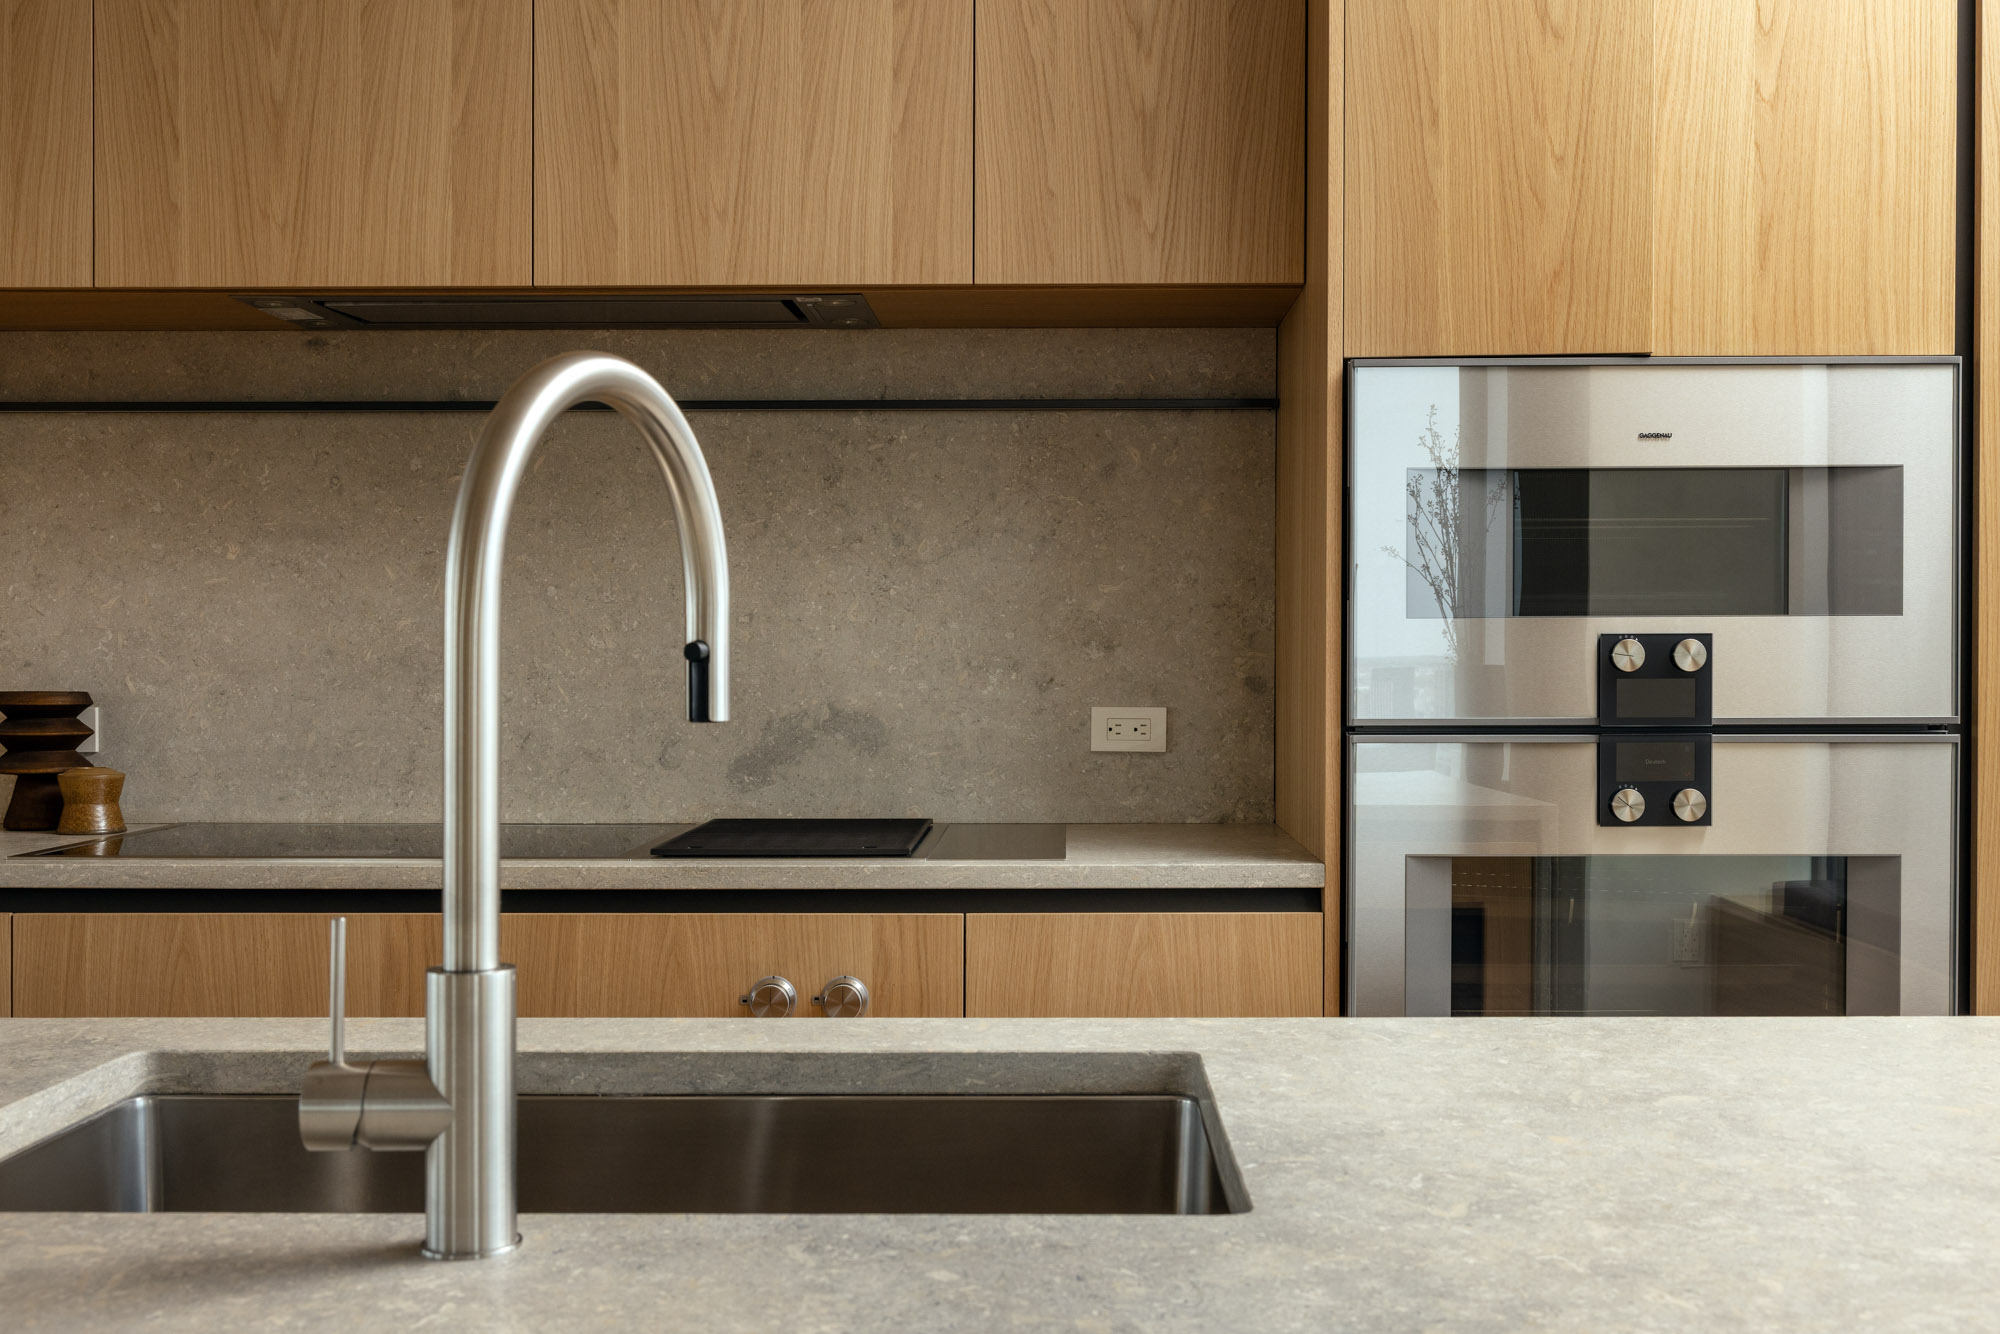
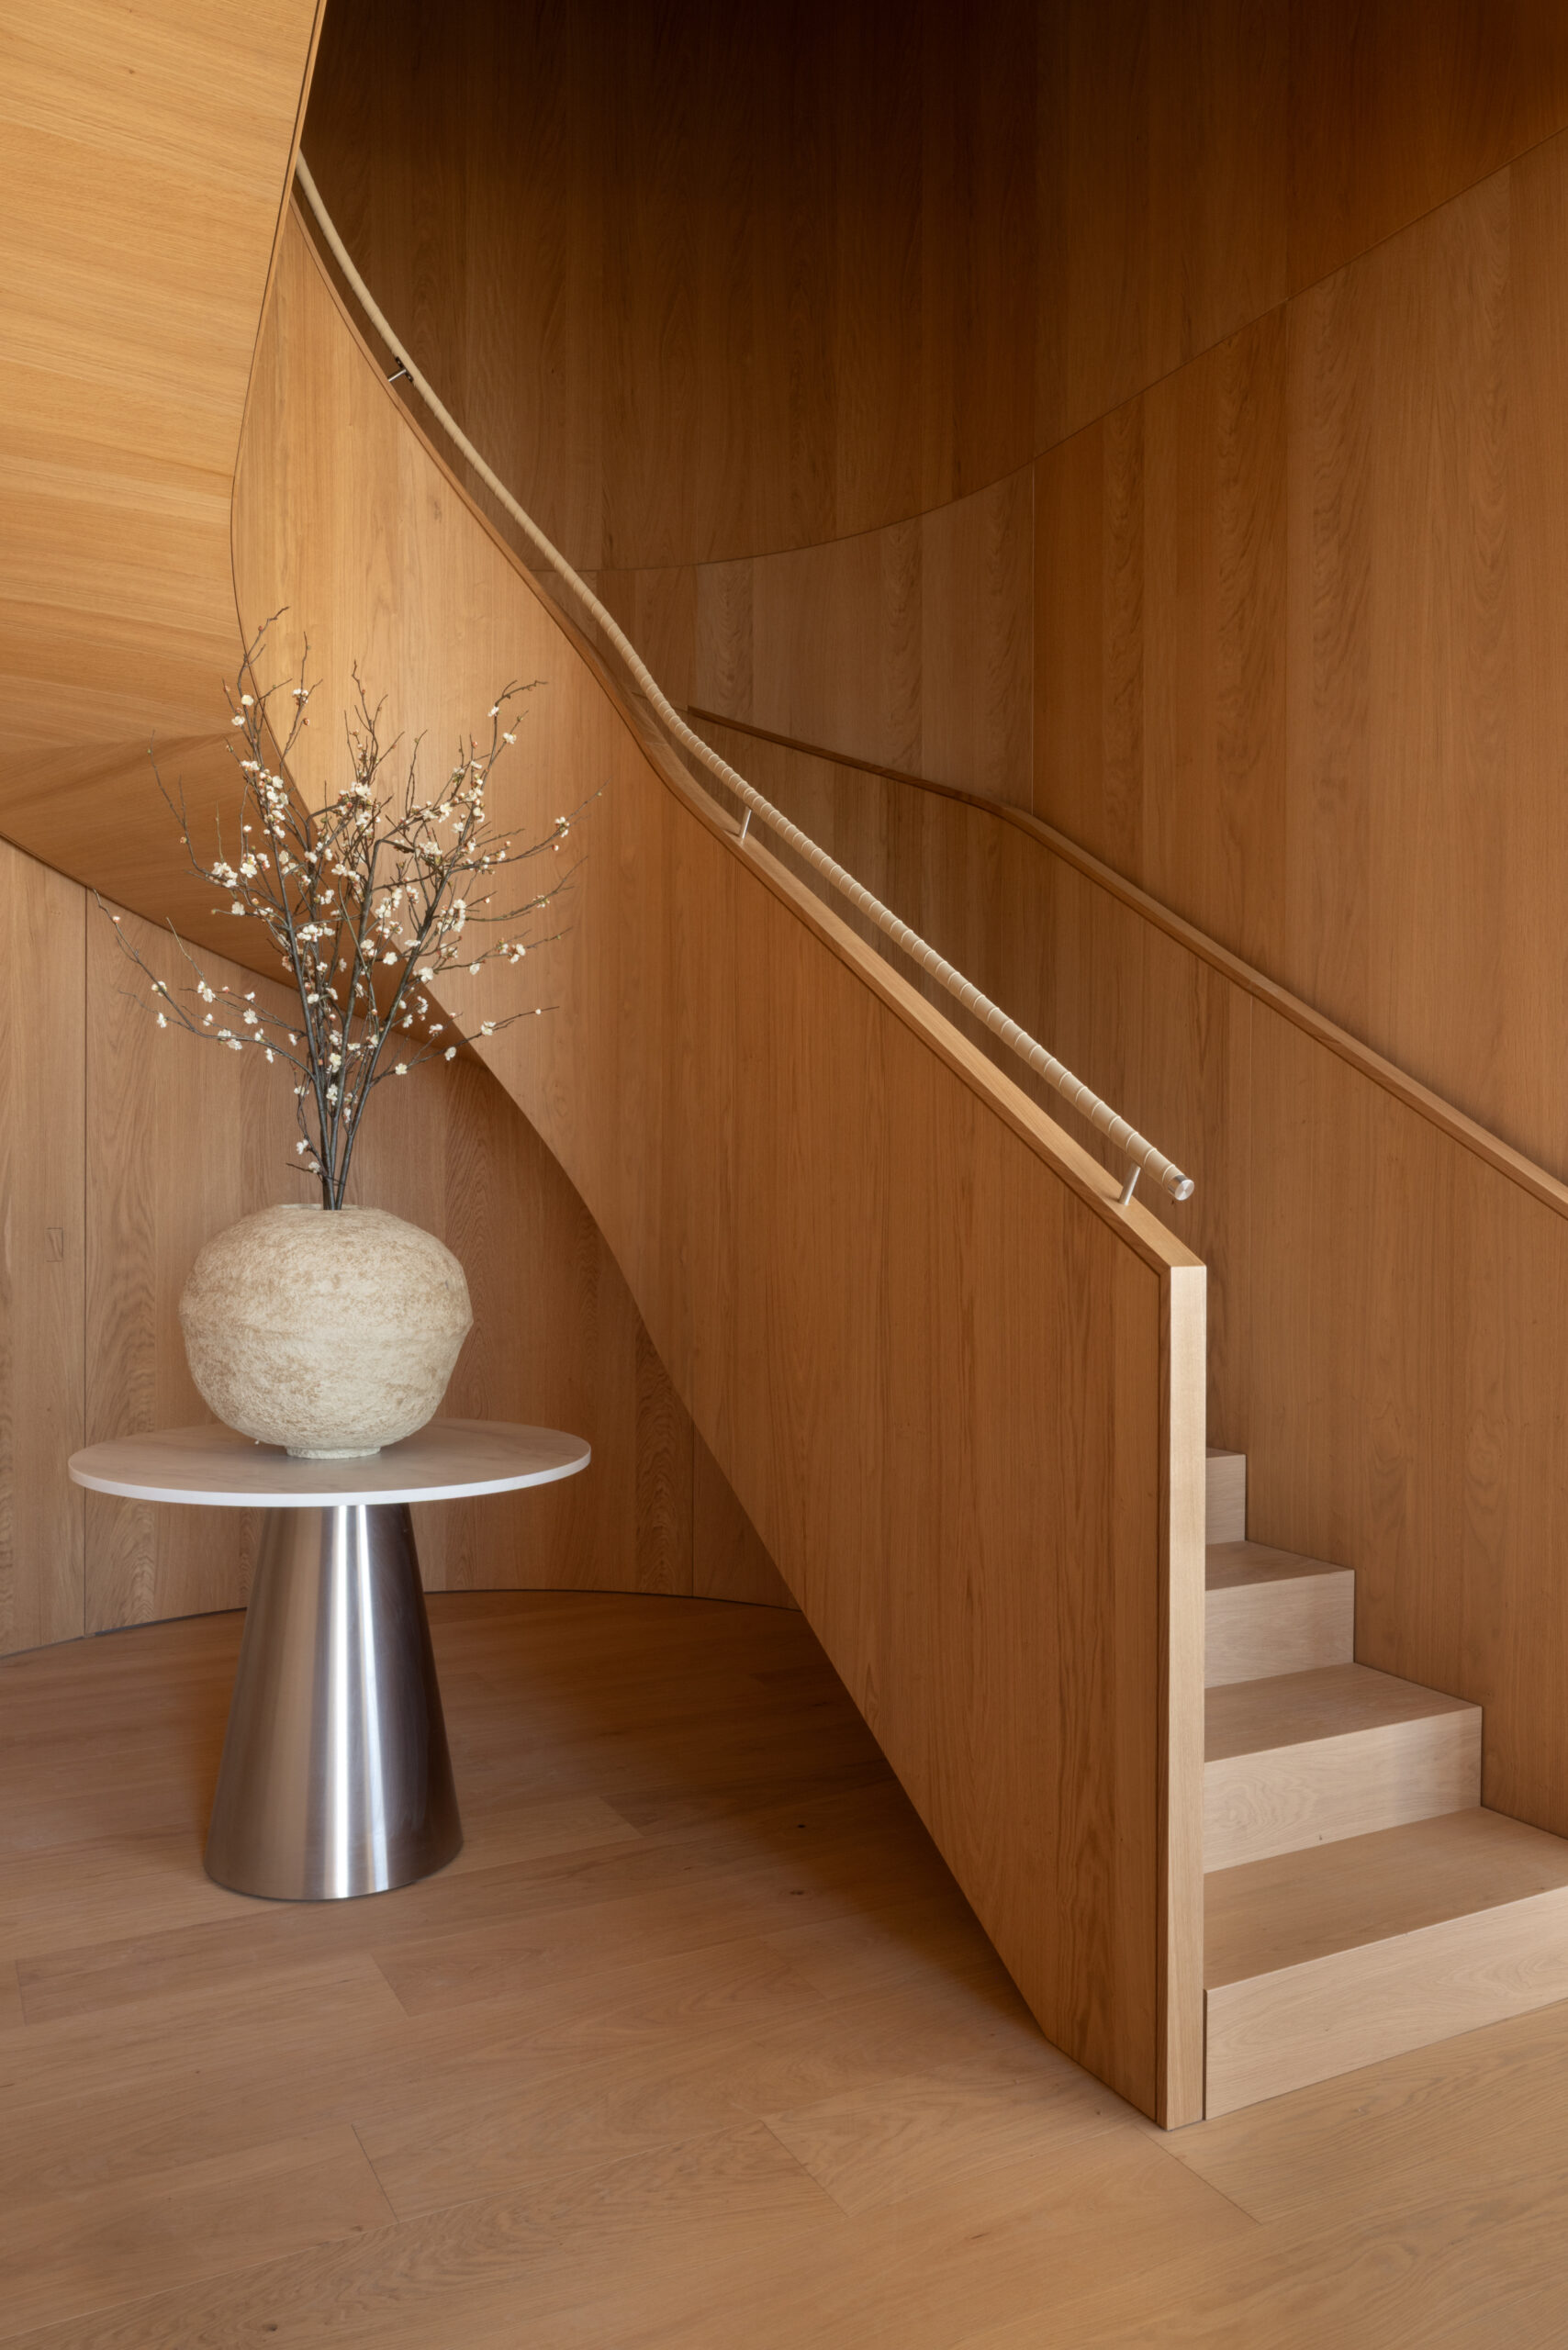
The first official interior renderings below highlight an upper level unit and its column-free layout. Floor-to-ceiling windows will frame panoramas of the Lower Manhattan skyline to the south and close-up vistas of the Empire State Building to the north. The apartments will make extensive use of wood paneling, and duplex units will feature spiral staircases. One of the eastern elevation’s porthole windows is visible in the first living room image.
Rendering courtesy of Hayes Davidson.
Amenities will include a fitness center, as seen below. The full list of amenities has yet to be revealed.
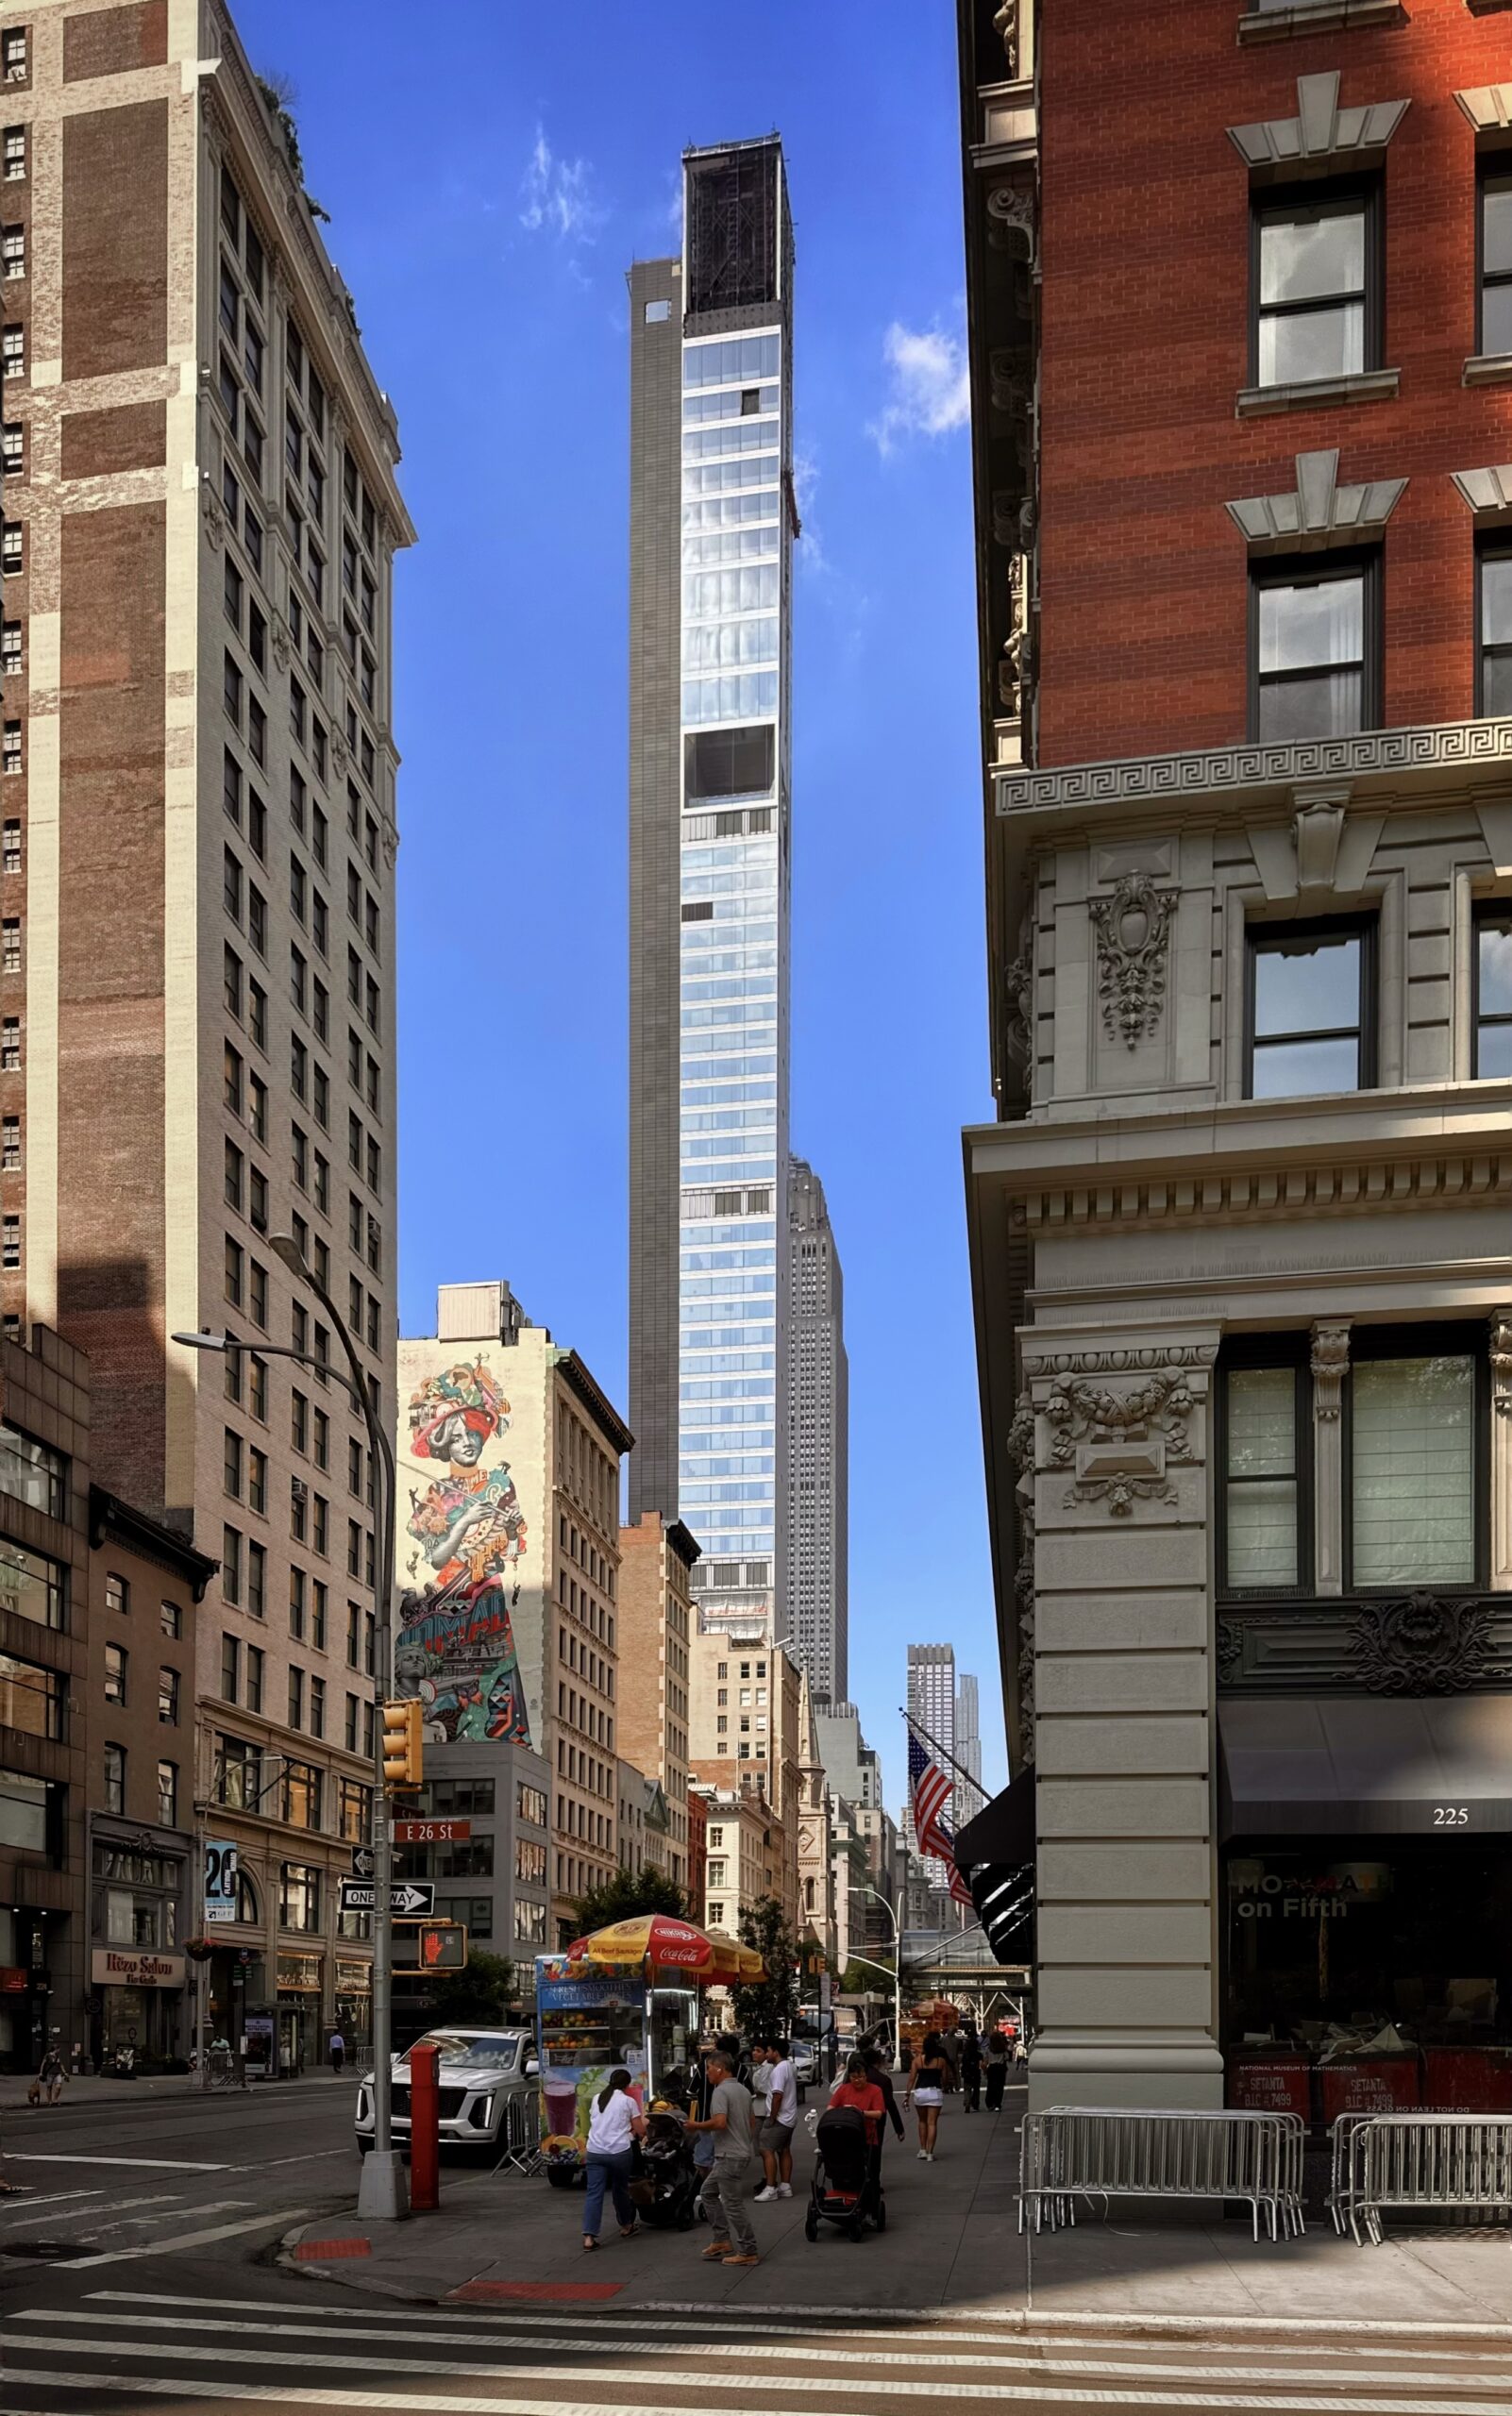
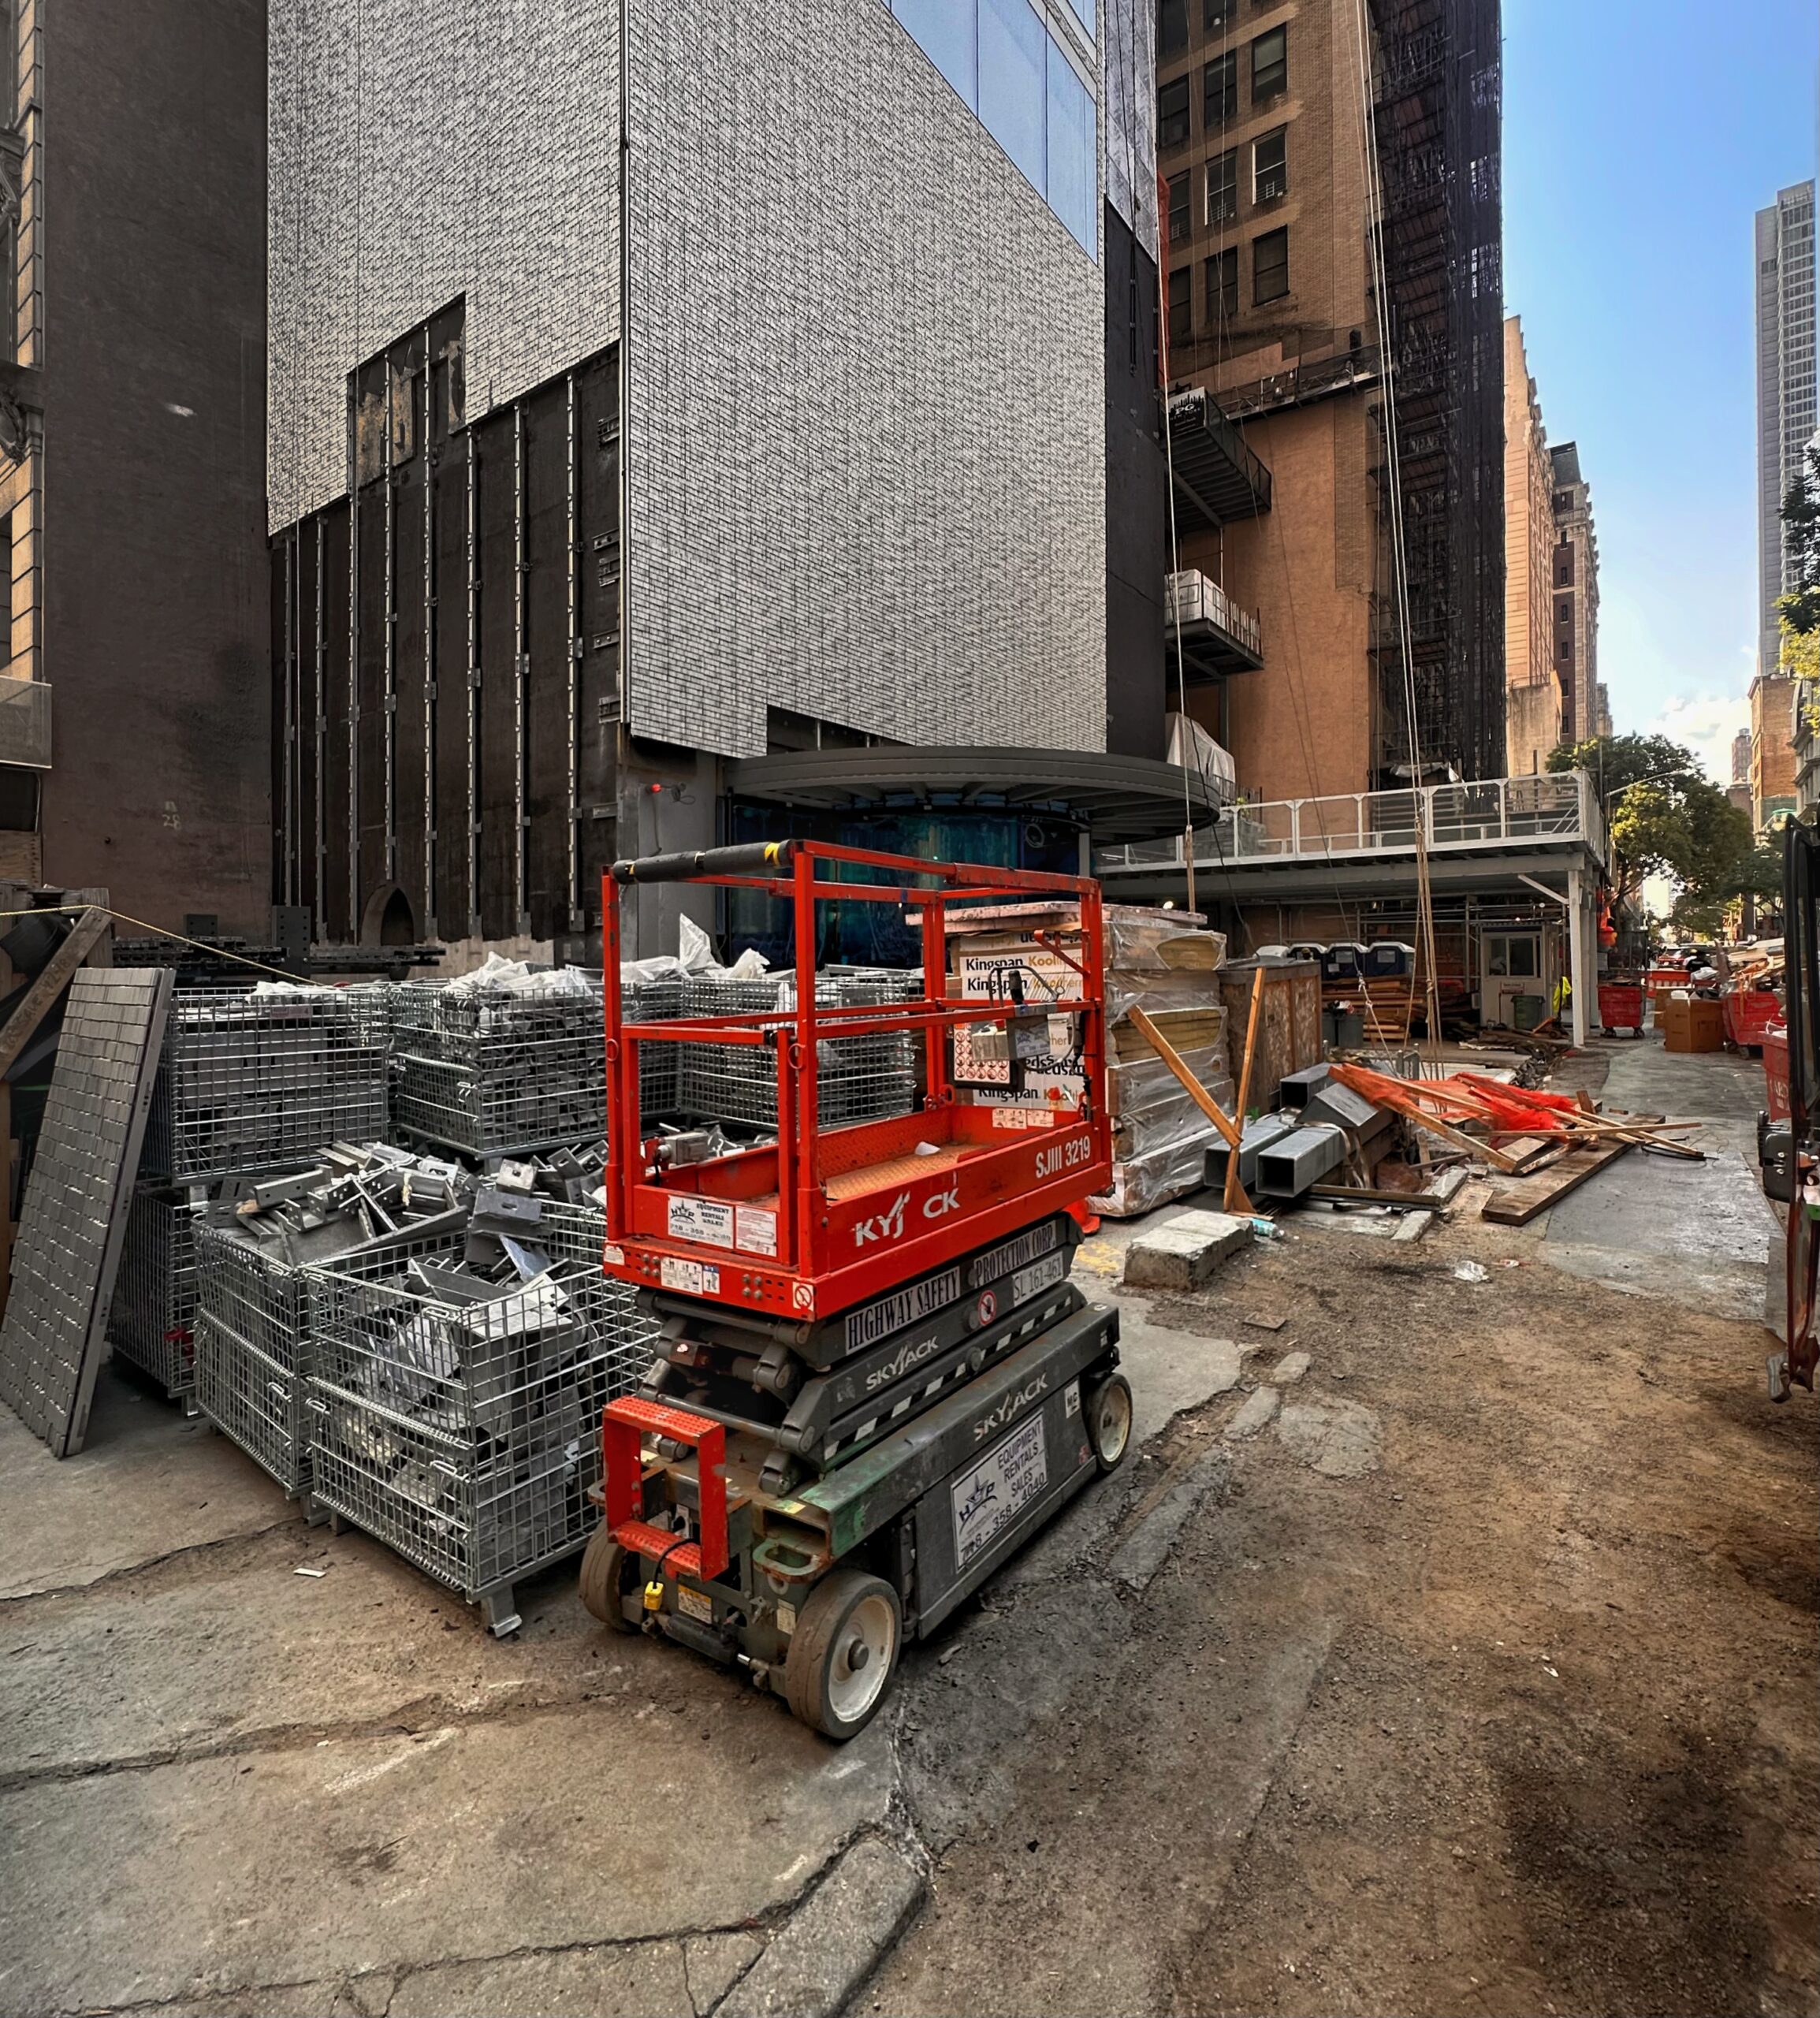
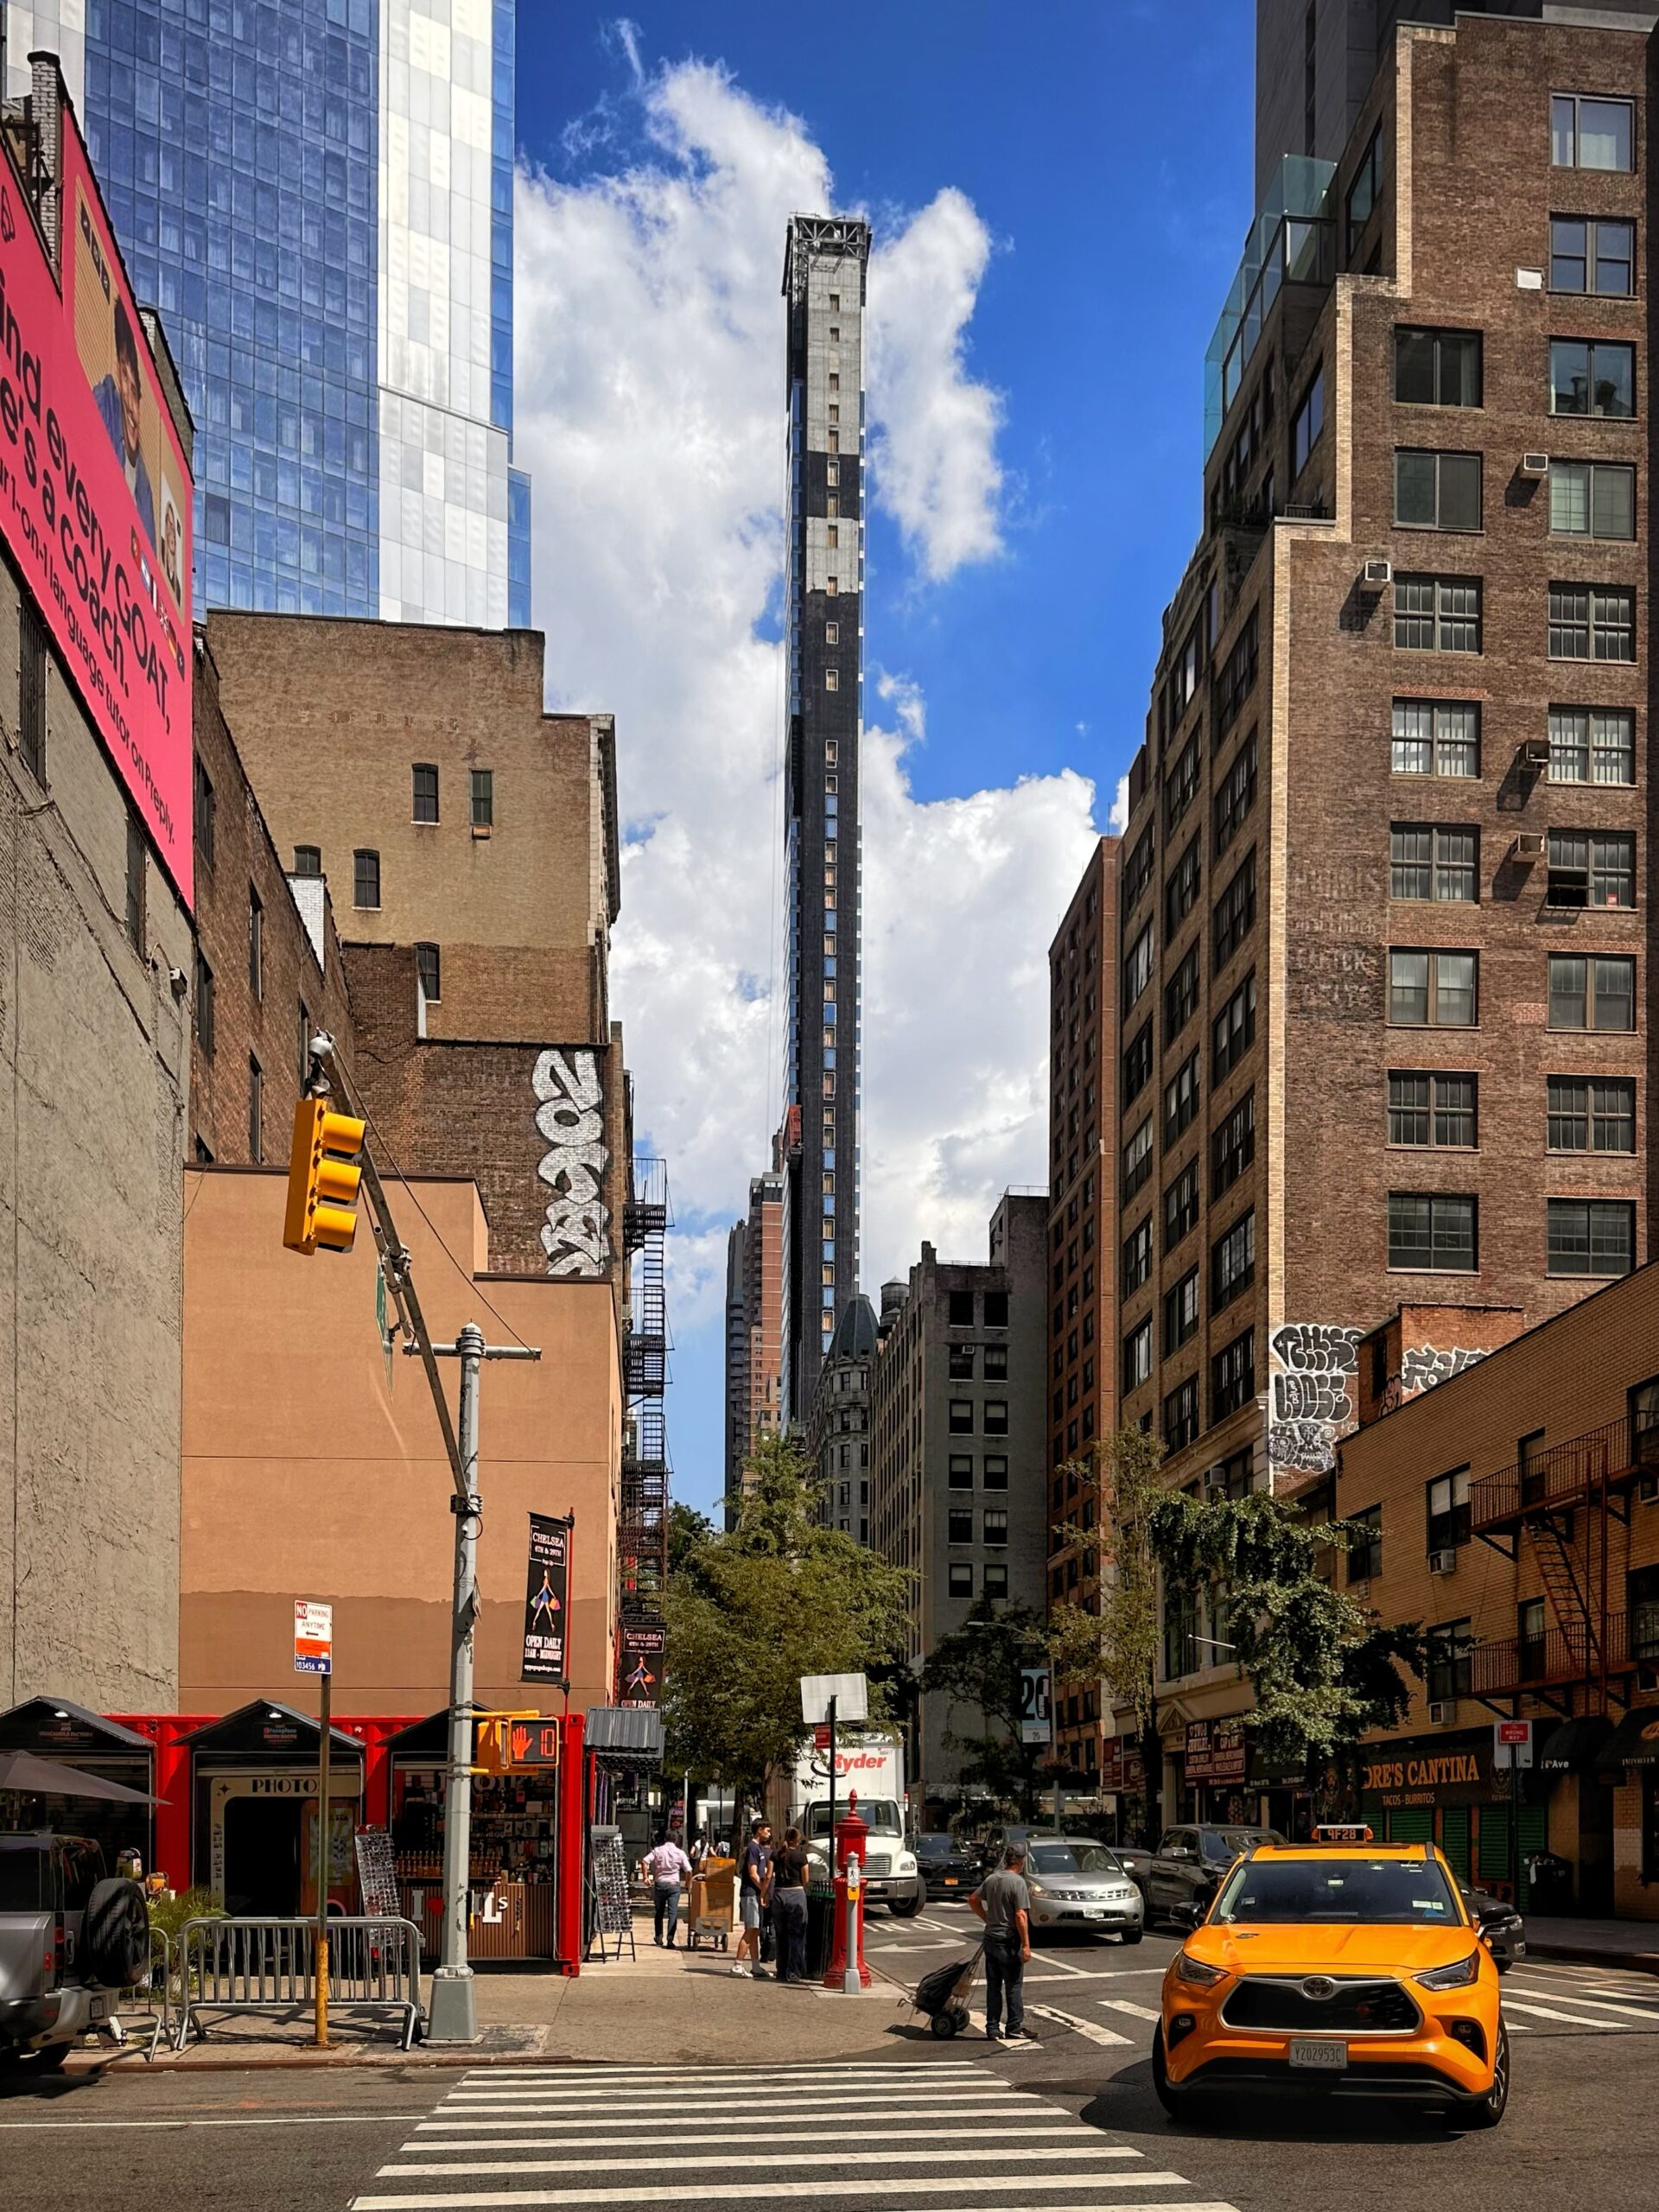
Nearly all of the remaining black photovoltaic paneling has been installed on the southern face of the skyscraper’s core since our last update in early April, when the hoist was still mounted to this wall. The same materials will be applied to the western and northern sides of the core, creating a contrast with the reflective glass curtain wall.
262 Fifth Avenue. Photo by Michael Young.
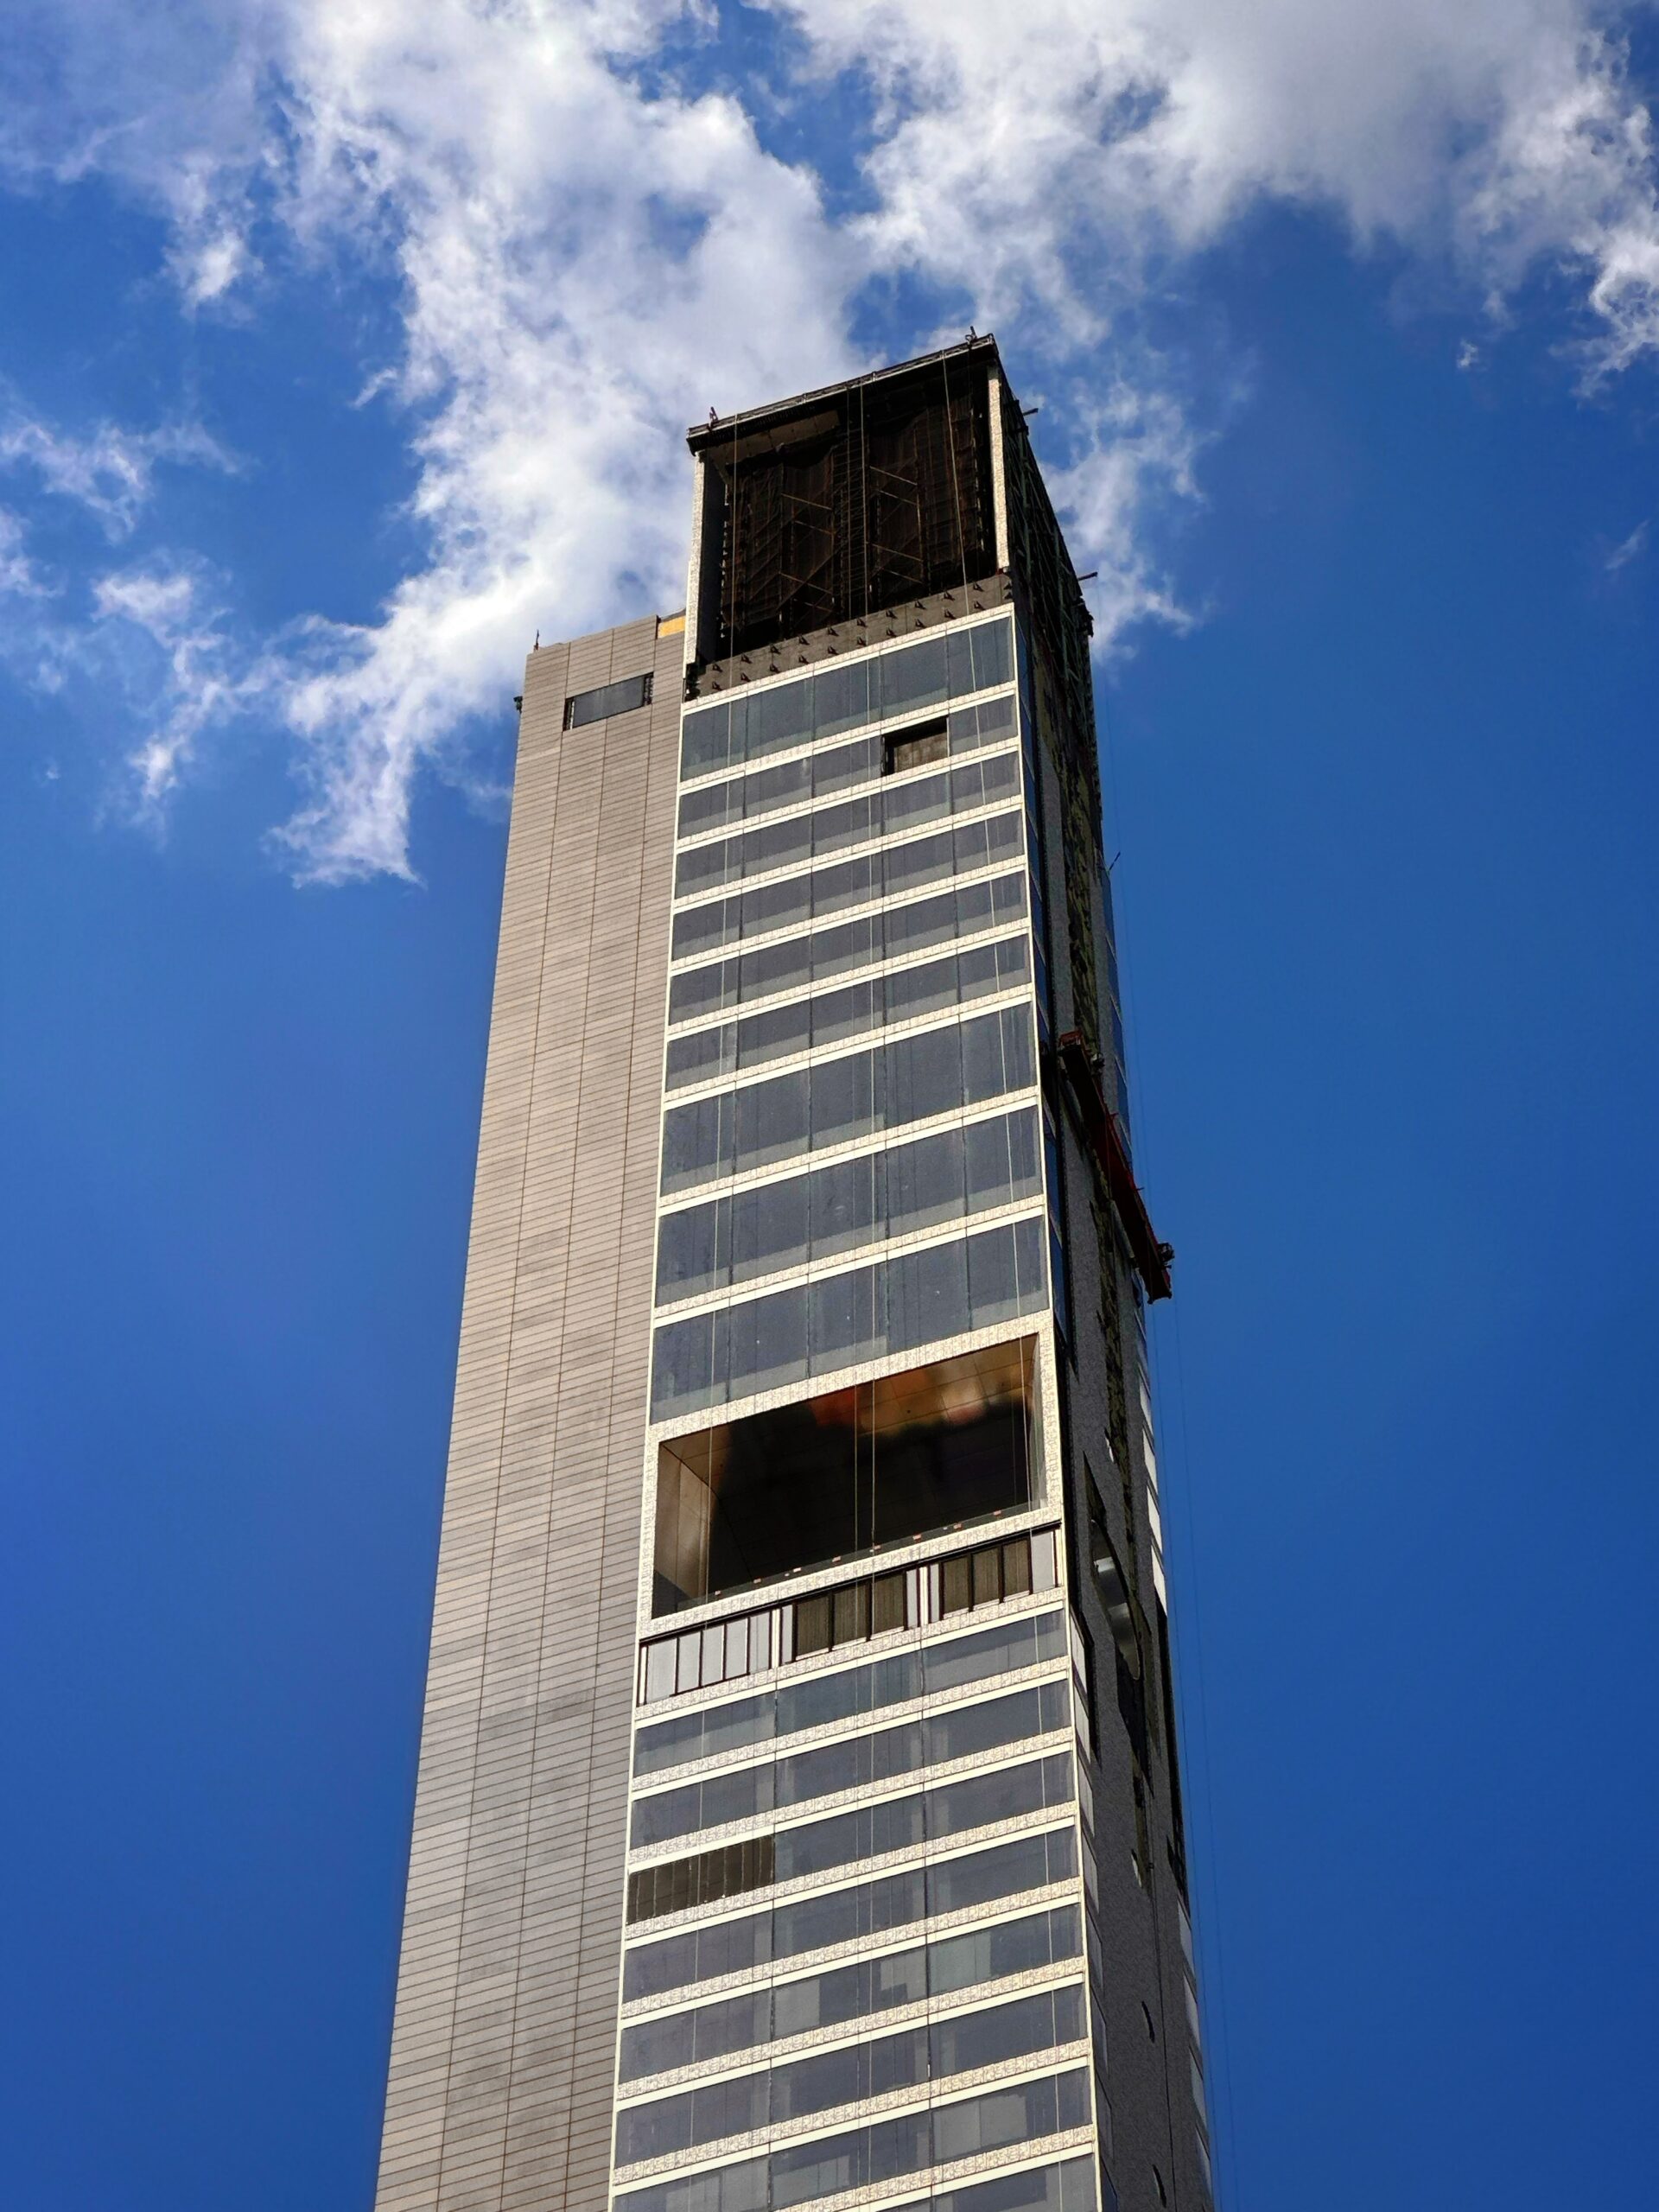
Work has also progressed on the midpoint cutout, which is now lined with its aluminum paneling.
g.
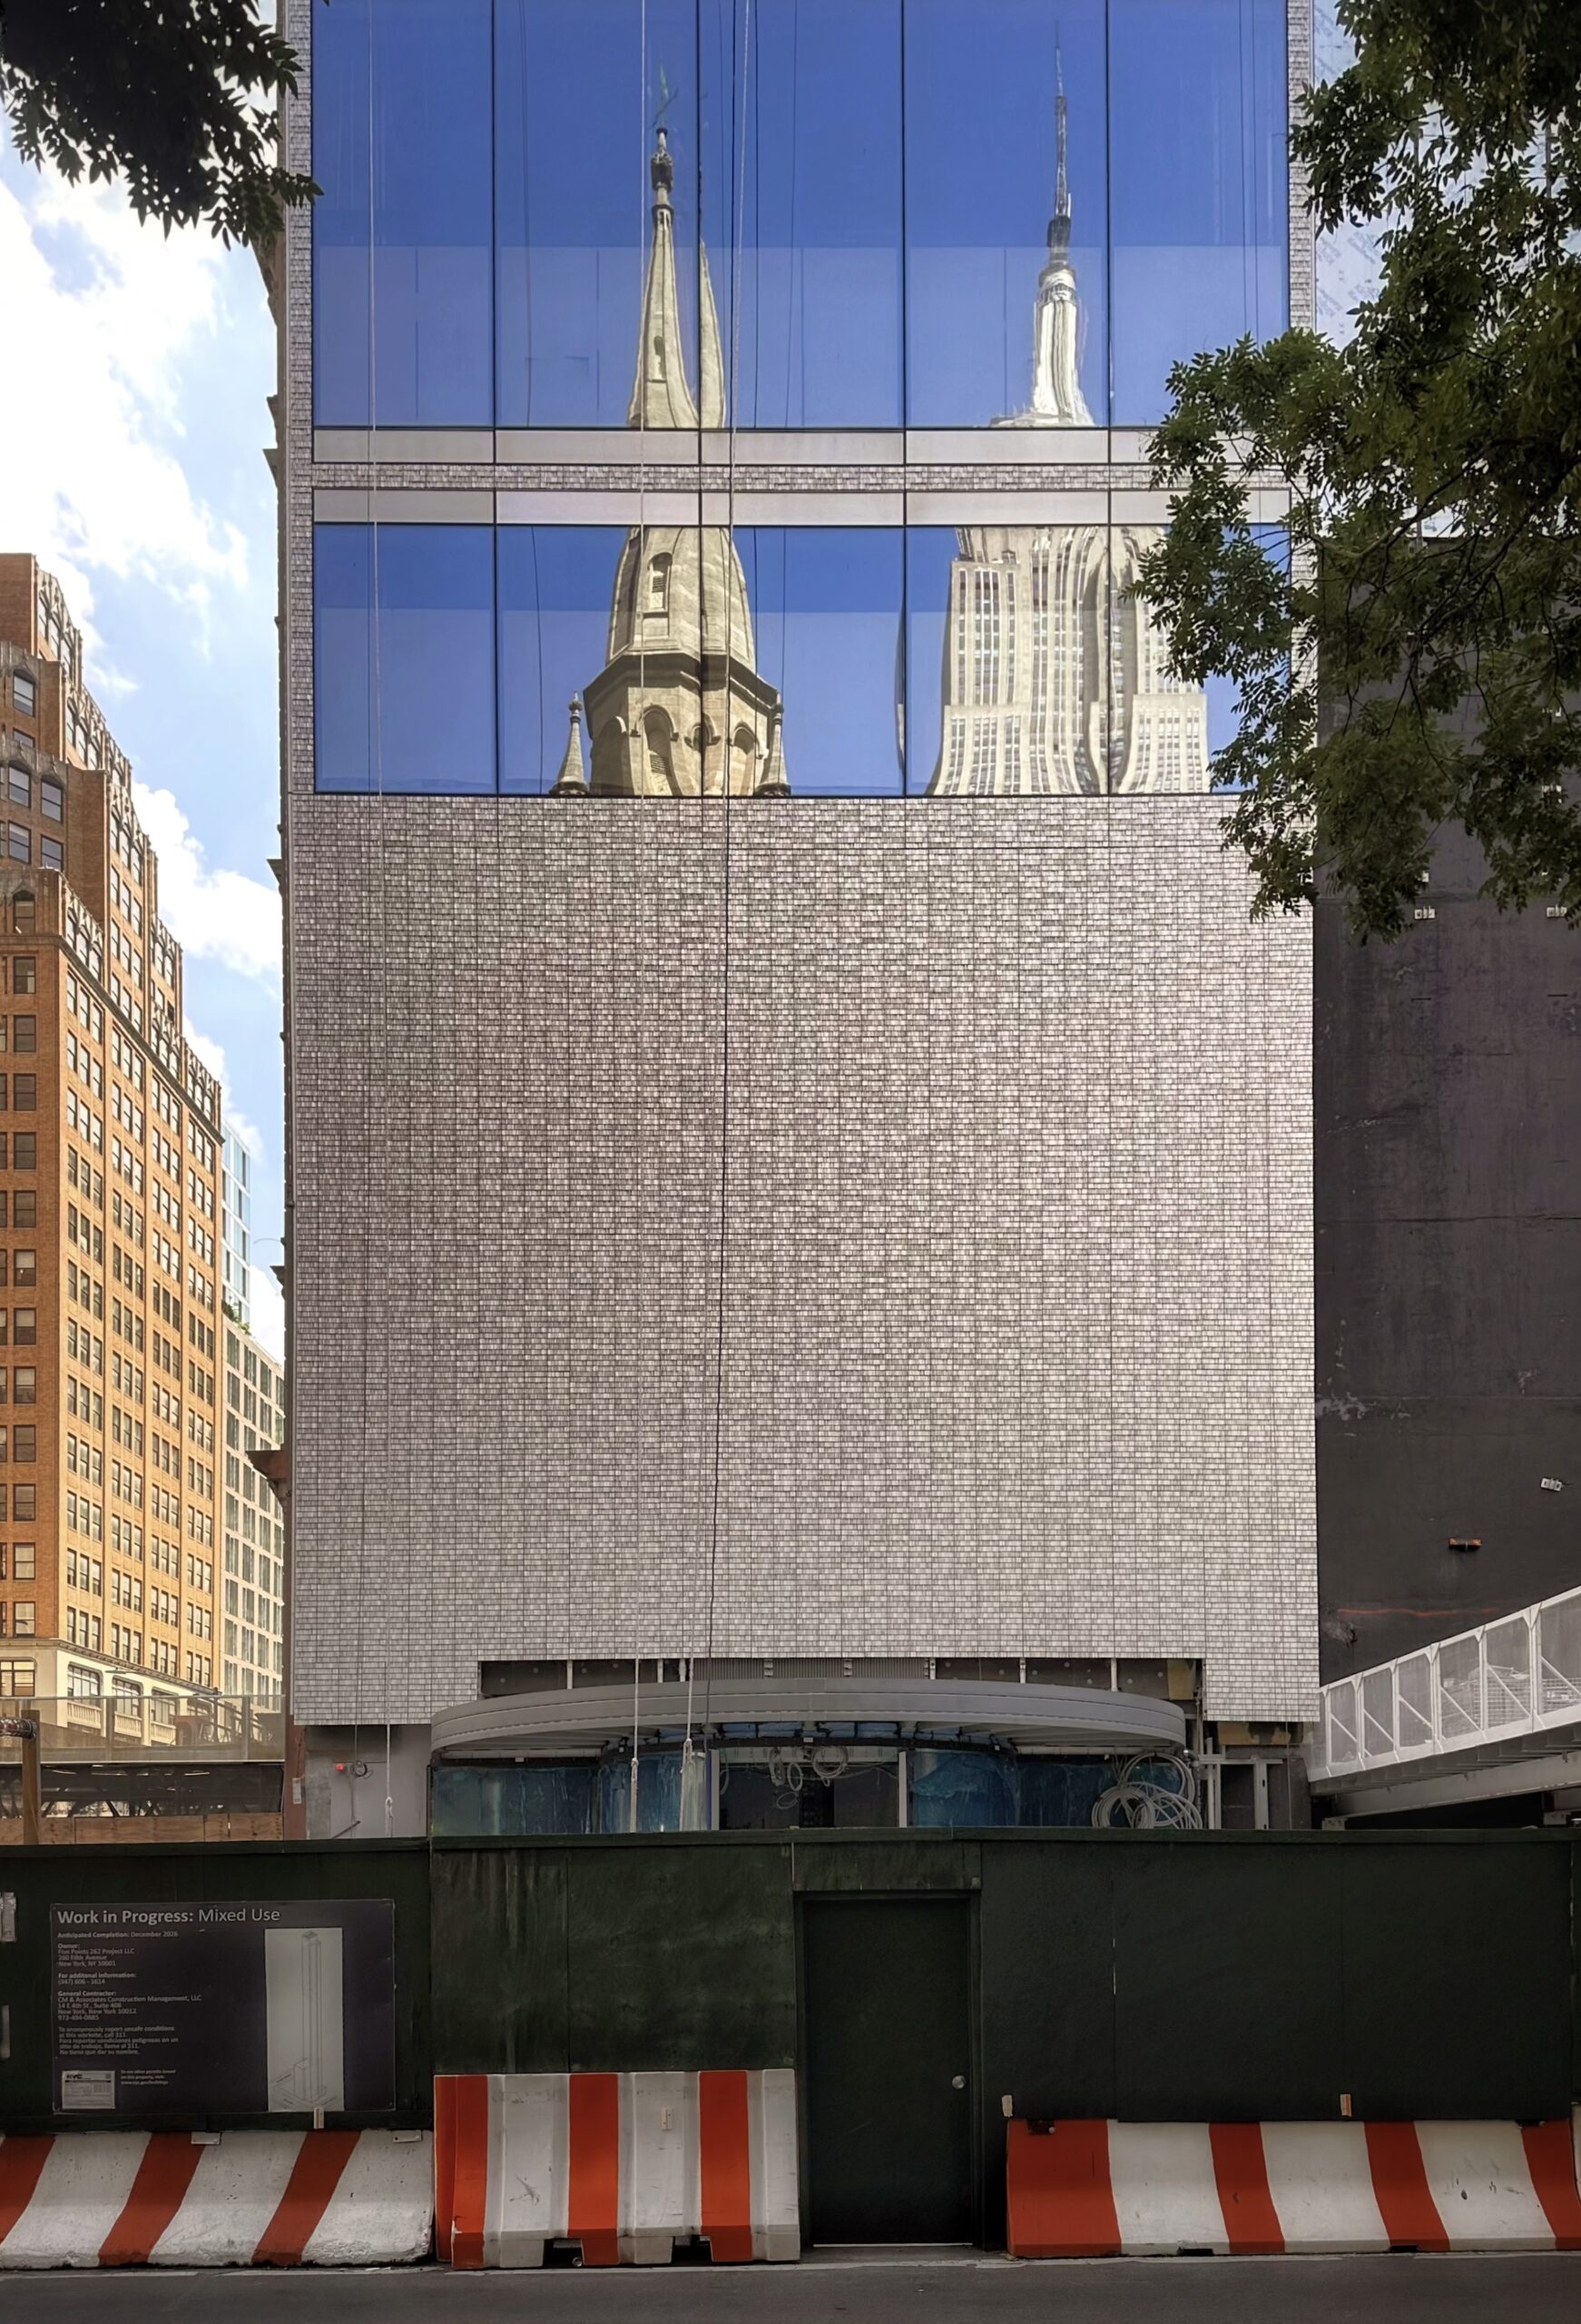
Sidewalk barriers and metal fencing still surround the ground level of the property, where the cantilevering half-moon entrance canopy is taking shape.
262 Fifth Avenue. Photo by Michael Young.
Window installation is moving along on the slender western elevation. Many of the voids are still covered with wooden boards as crews continue to finish the core’s concrete surface.
Nikki Field and Ben Pofcher from The Field Team at Sotheby’s International Realty will lead sales and marketing for the units, working in partnership with The Sotheby’s International Realty Development Advisors.
The nearest subways from the development are the local R and W trains at the 28th Street station along Broadway.
262 Fifth Avenue’s anticipated completion date is slated for December 2026, as updated on the info board.
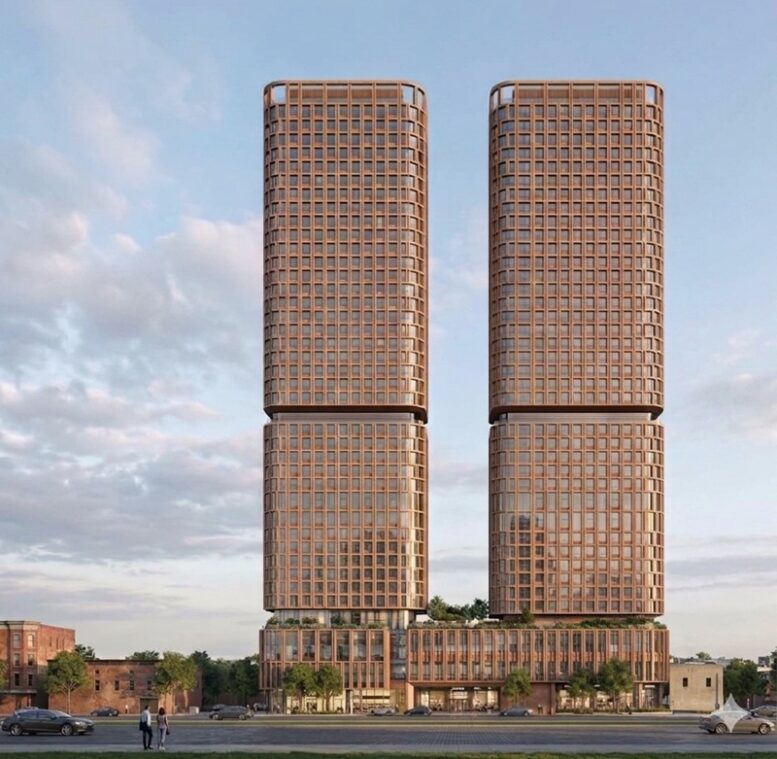
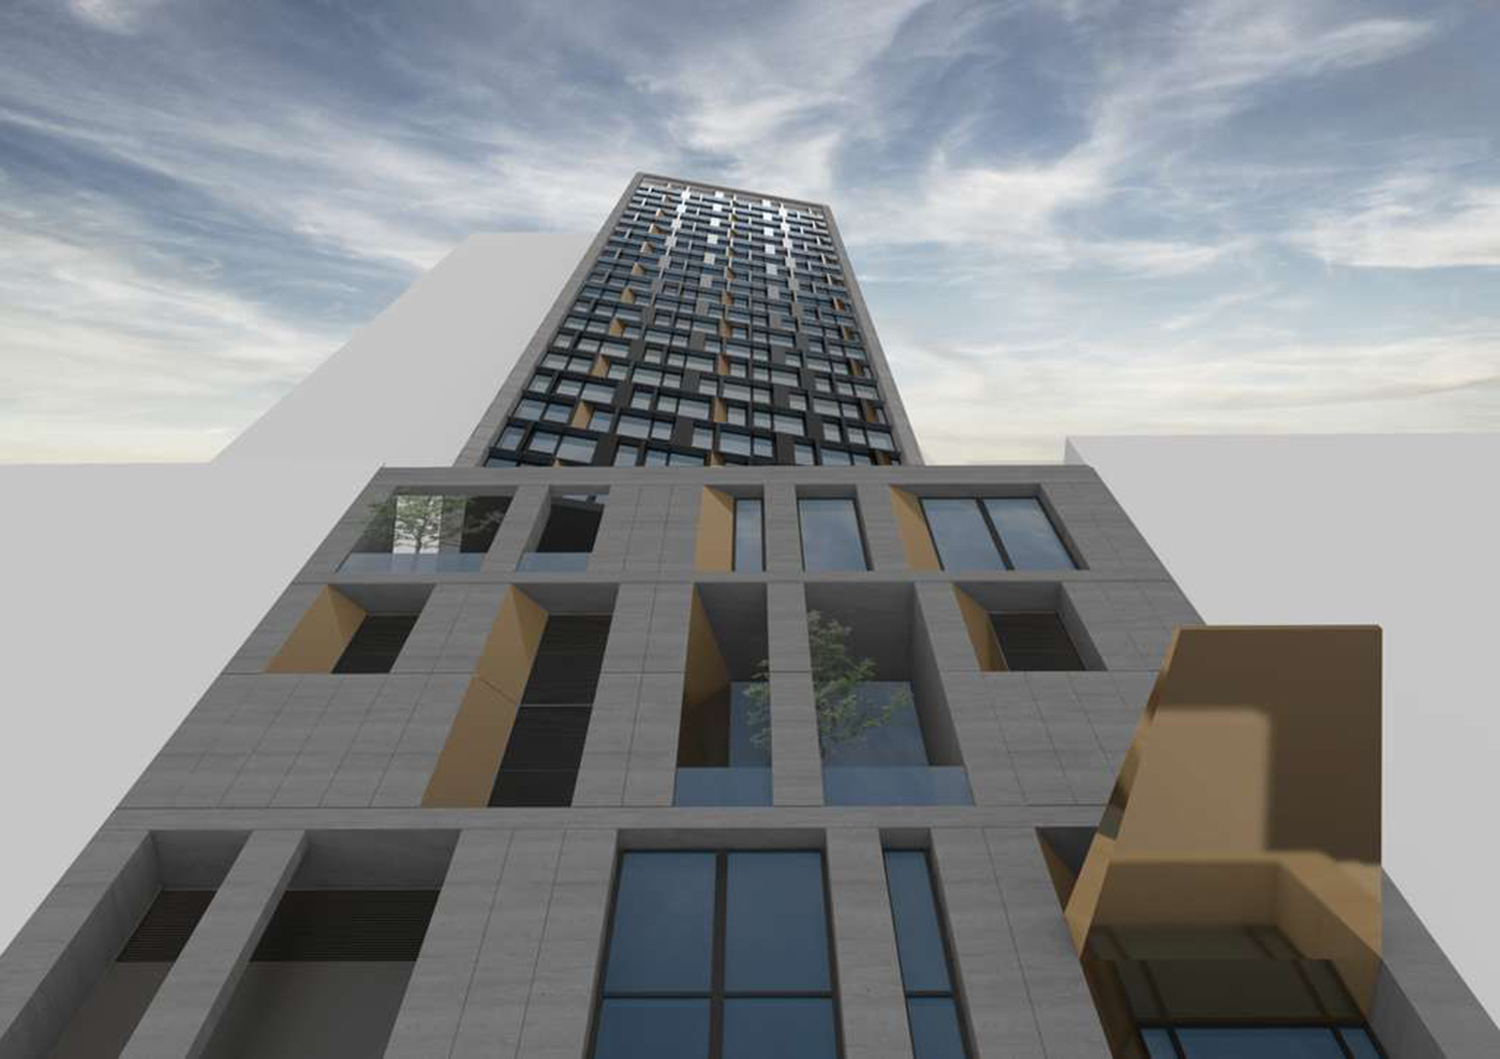
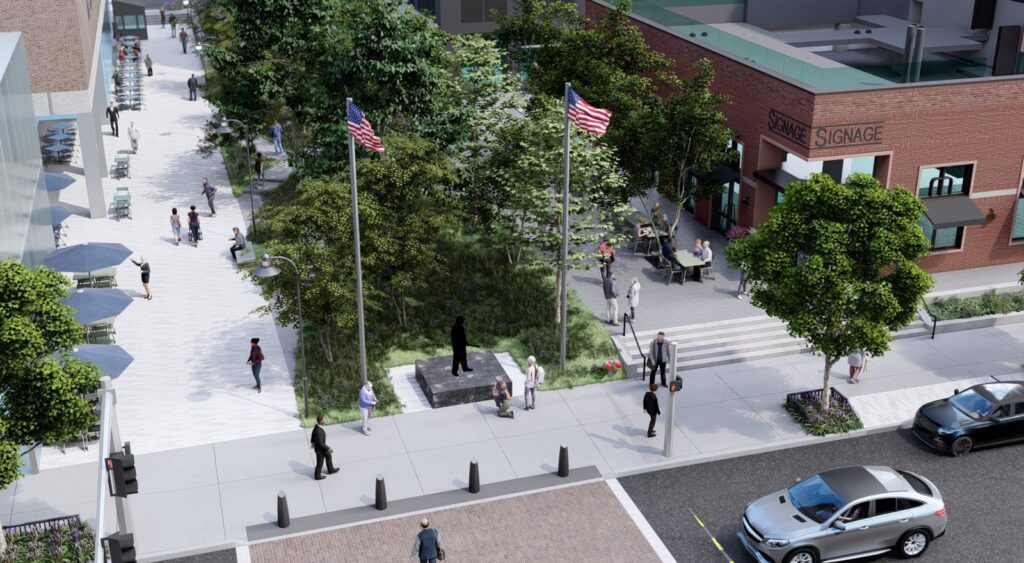
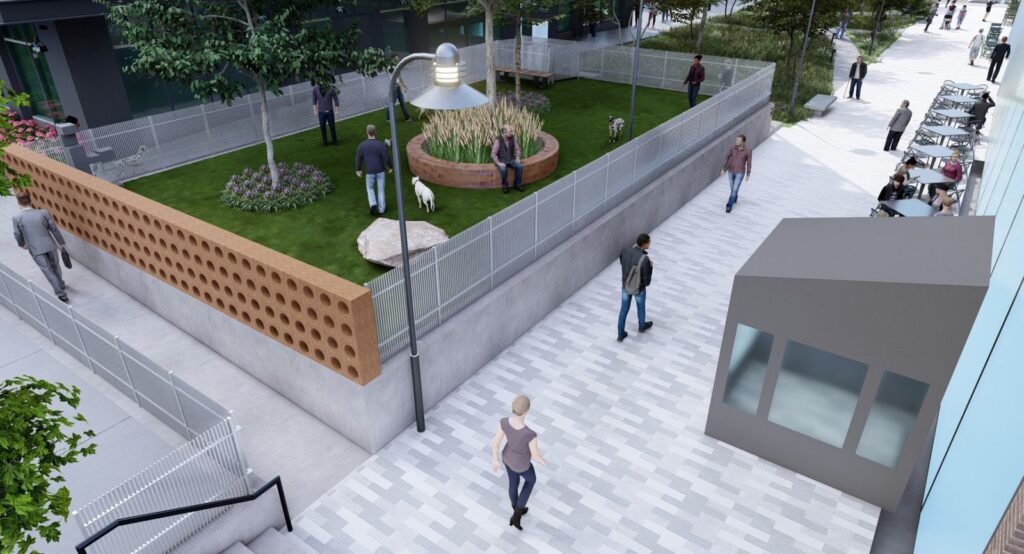
A new rendering has been revealed for 168 Sip Avenue, a proposed 35-story two-tower residential building in Journal Square, Jersey City. The project would be built in two phases and is planned to yield 648 market-rate units, 72 affordable housing units, and 7,600 square feet of ground-floor commercial space. The development would also include a 200-vehicle parking garage. The 0.81-acre property is located at the corner of Sip and Tonnelle Avenues, within the Journal Square 2060 Rehabilitation Area.
JLL is the marketing team behind the project. An architect has not be disclosed, and the unnamed developer is seeking a partner for a joint venture.
The rendering depicts the southern elevation along Sip Avenue. The structure will begin with a multistory podium topped with a landscaped terrace with trees at its center. Above, the twin towers will rise in matching volumes featuring curved corners and cutouts just above the one-third mark, and will culminate in bulkheads surrounded by extensions of the façade grid. The eastern tower appears slightly broader than its counterpart. The exterior will be composed of floor-to-ceiling windows framed by earth-toned paneling.
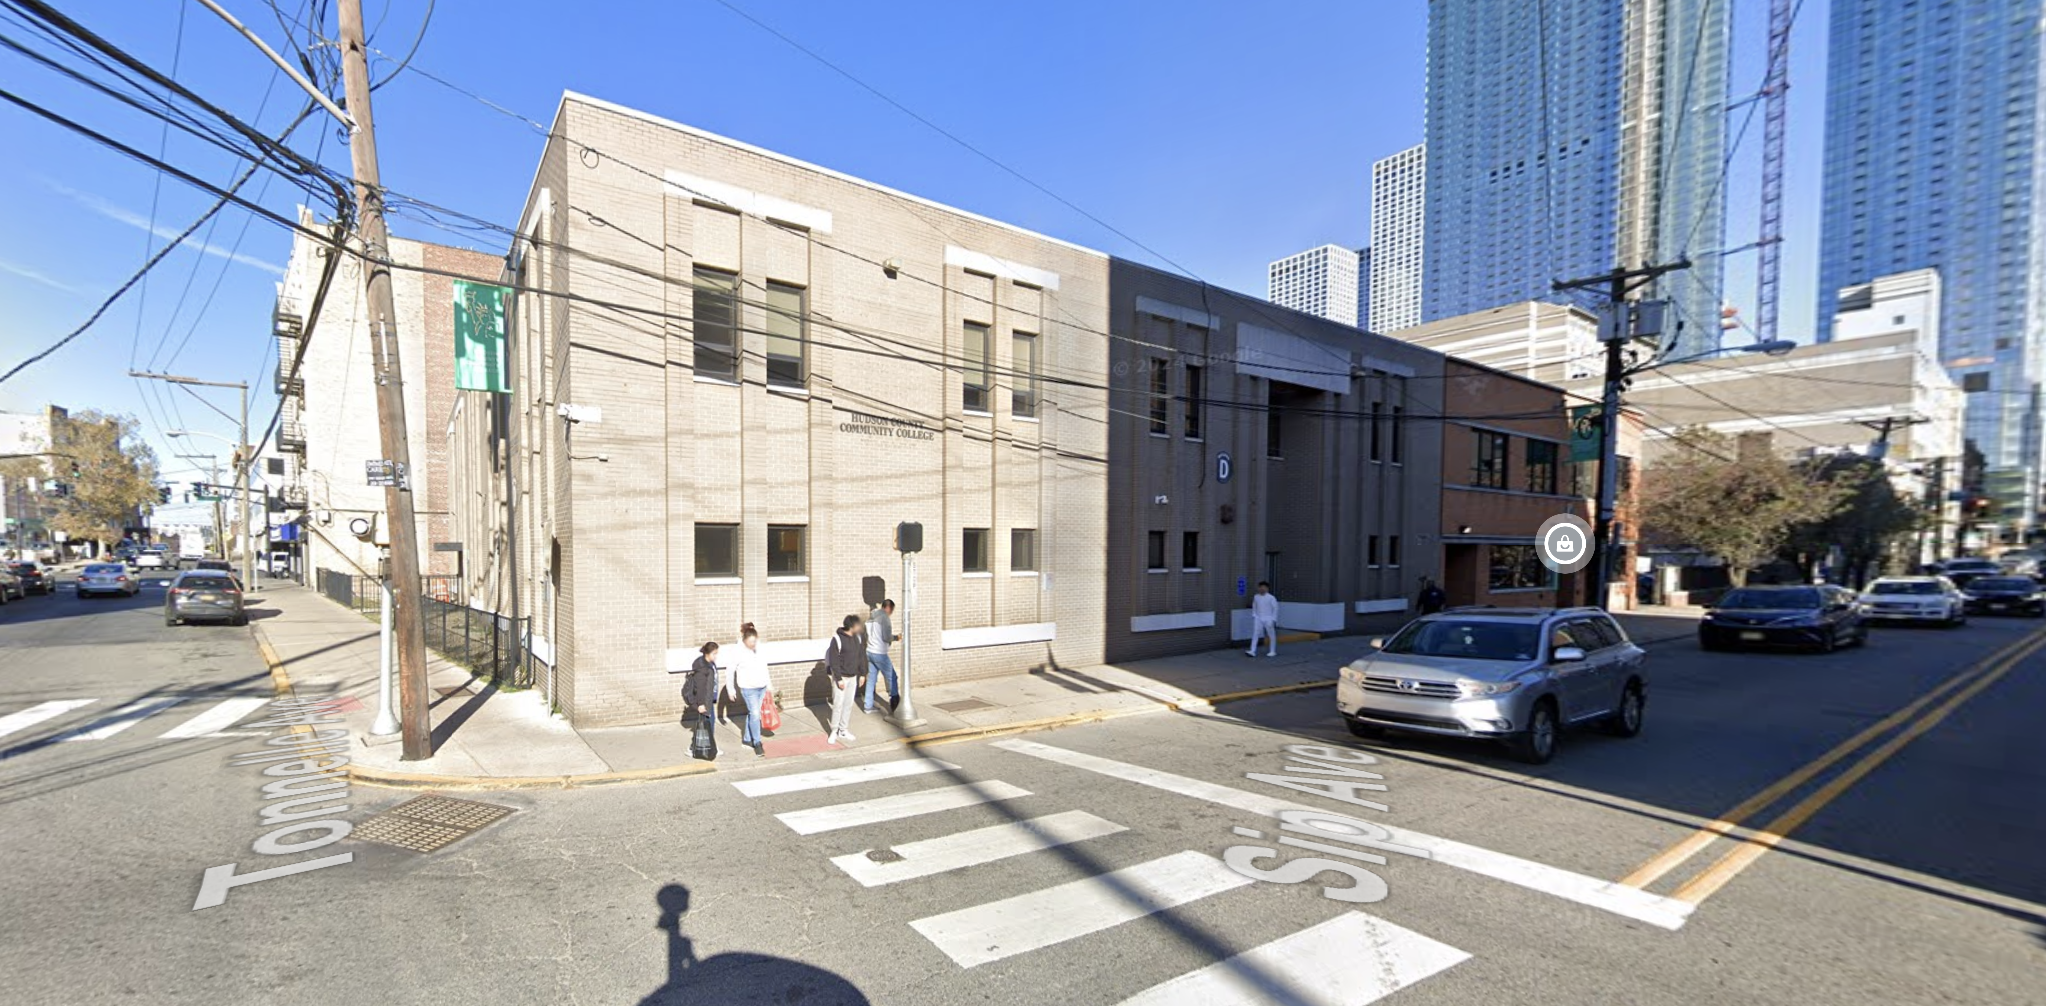
The property is currently occupied by a low-rise building owned by Hudson County Community College and an adjacent surface-level parking lot.
168 Sip Avenue, circa November 2024. Image via Google Maps.
The site is located in close proximity to the Journal Square PATH station, providing convenient access to New York.
An official application has yet to be submitted to the Jersey City Planning Board. A target completion date has not been announced.
By: Michael Young and Matt Pruznick 8:00 am on March 3, 2026
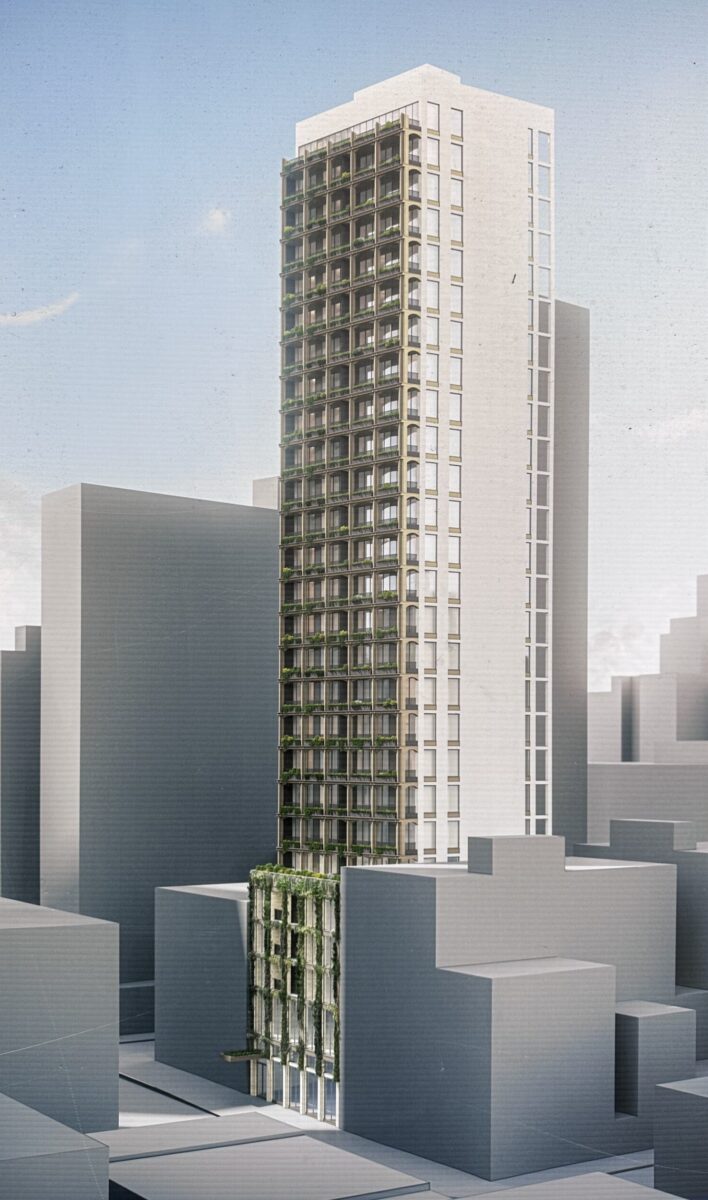
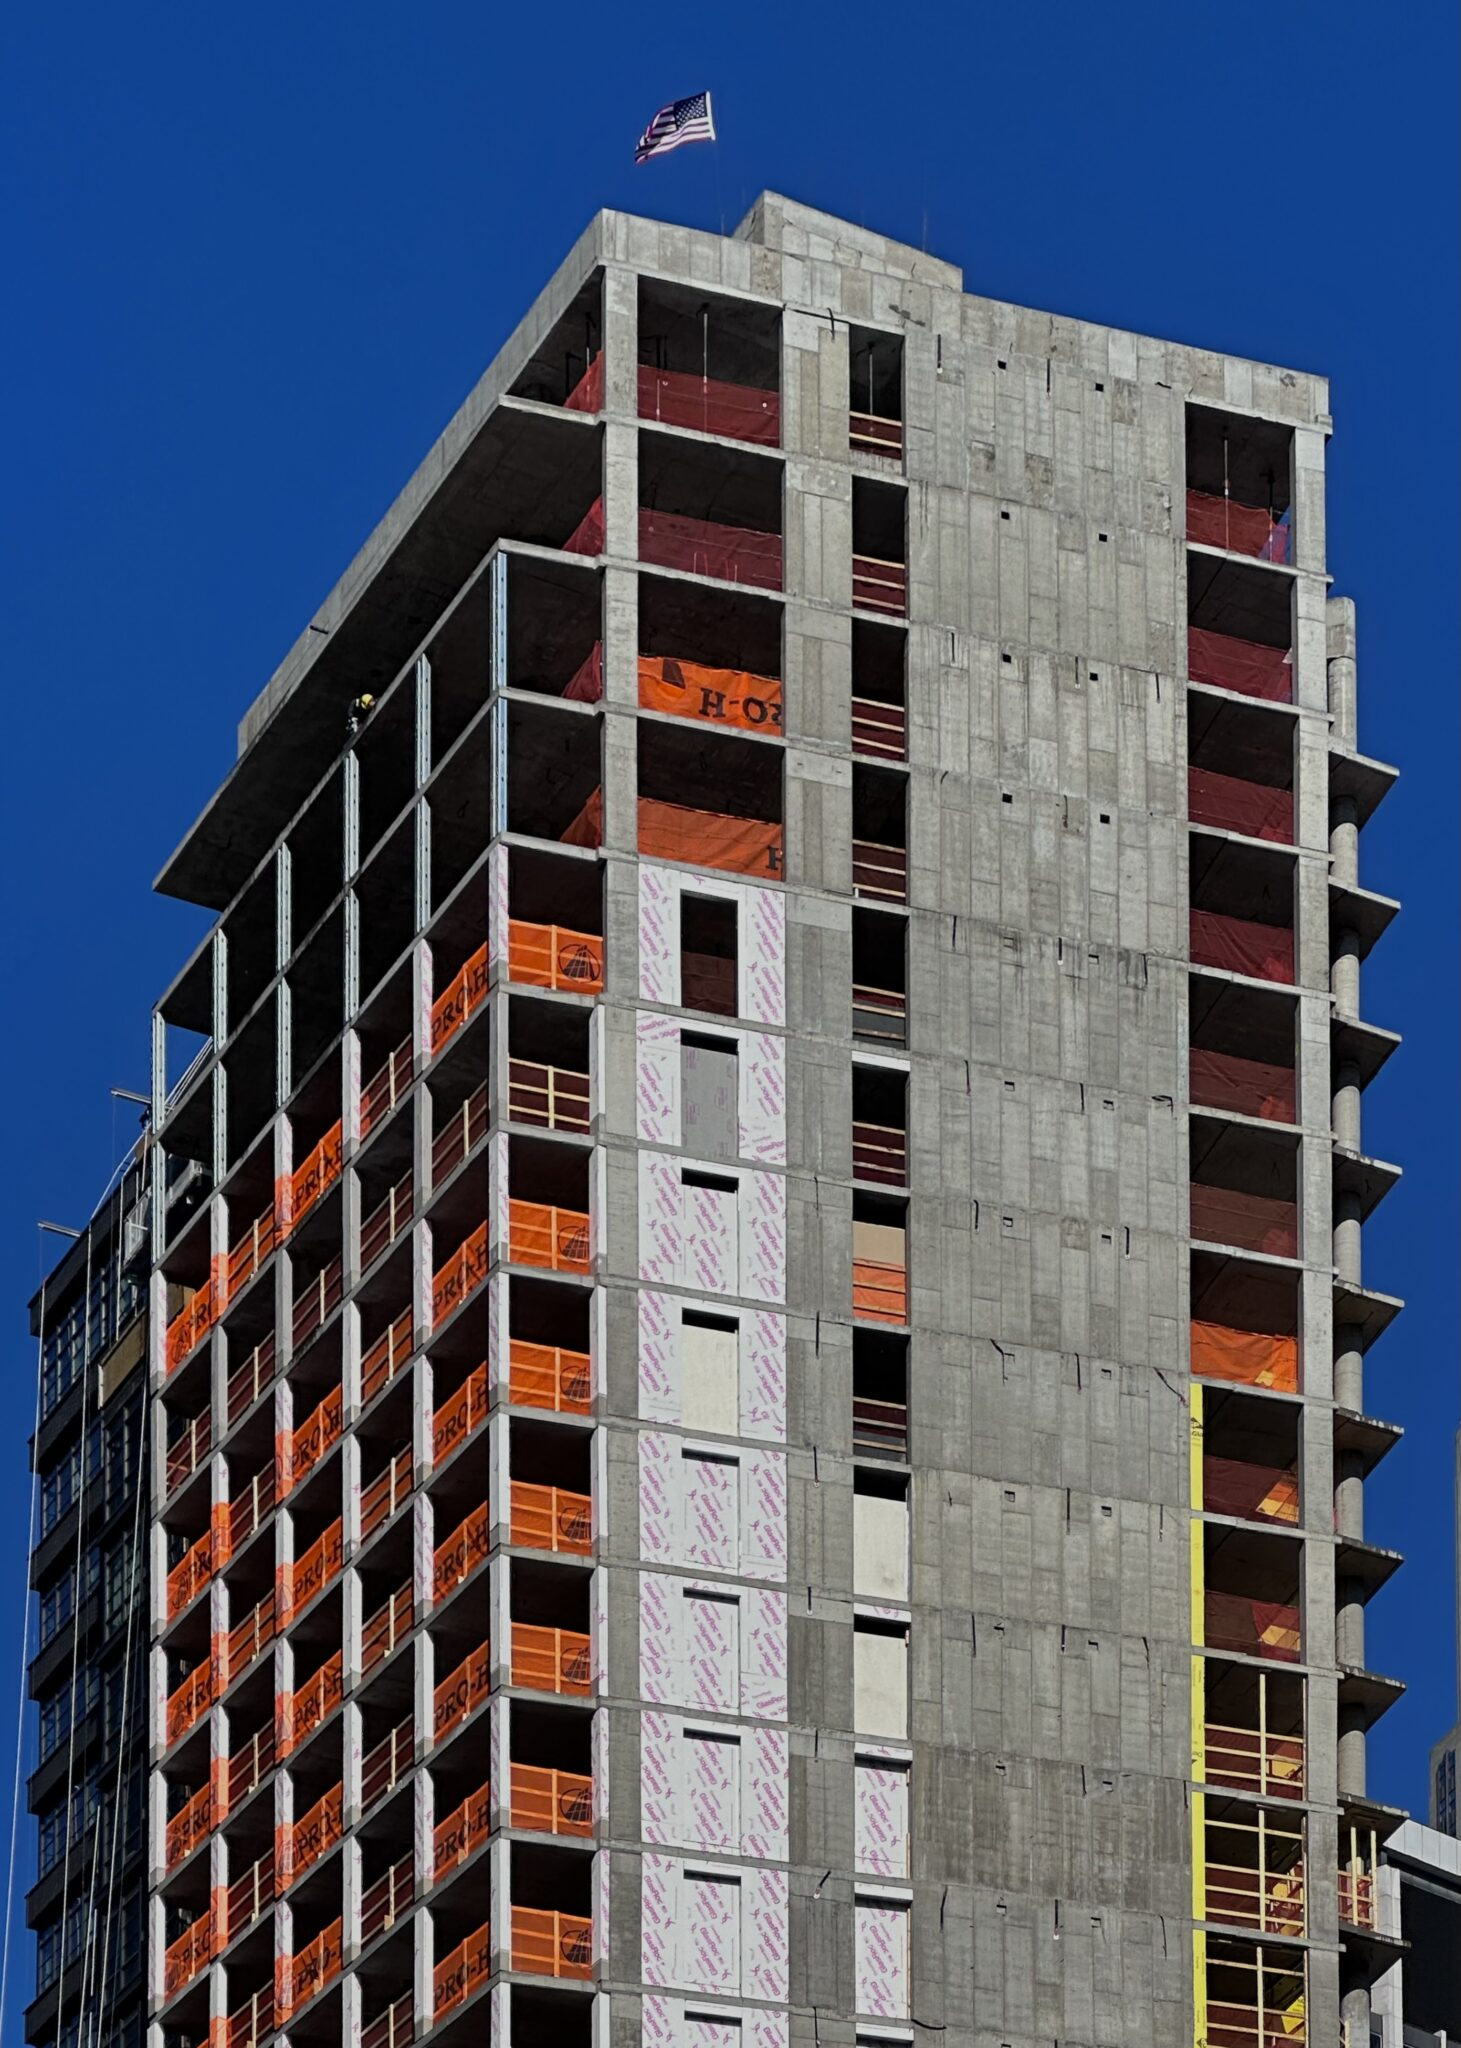
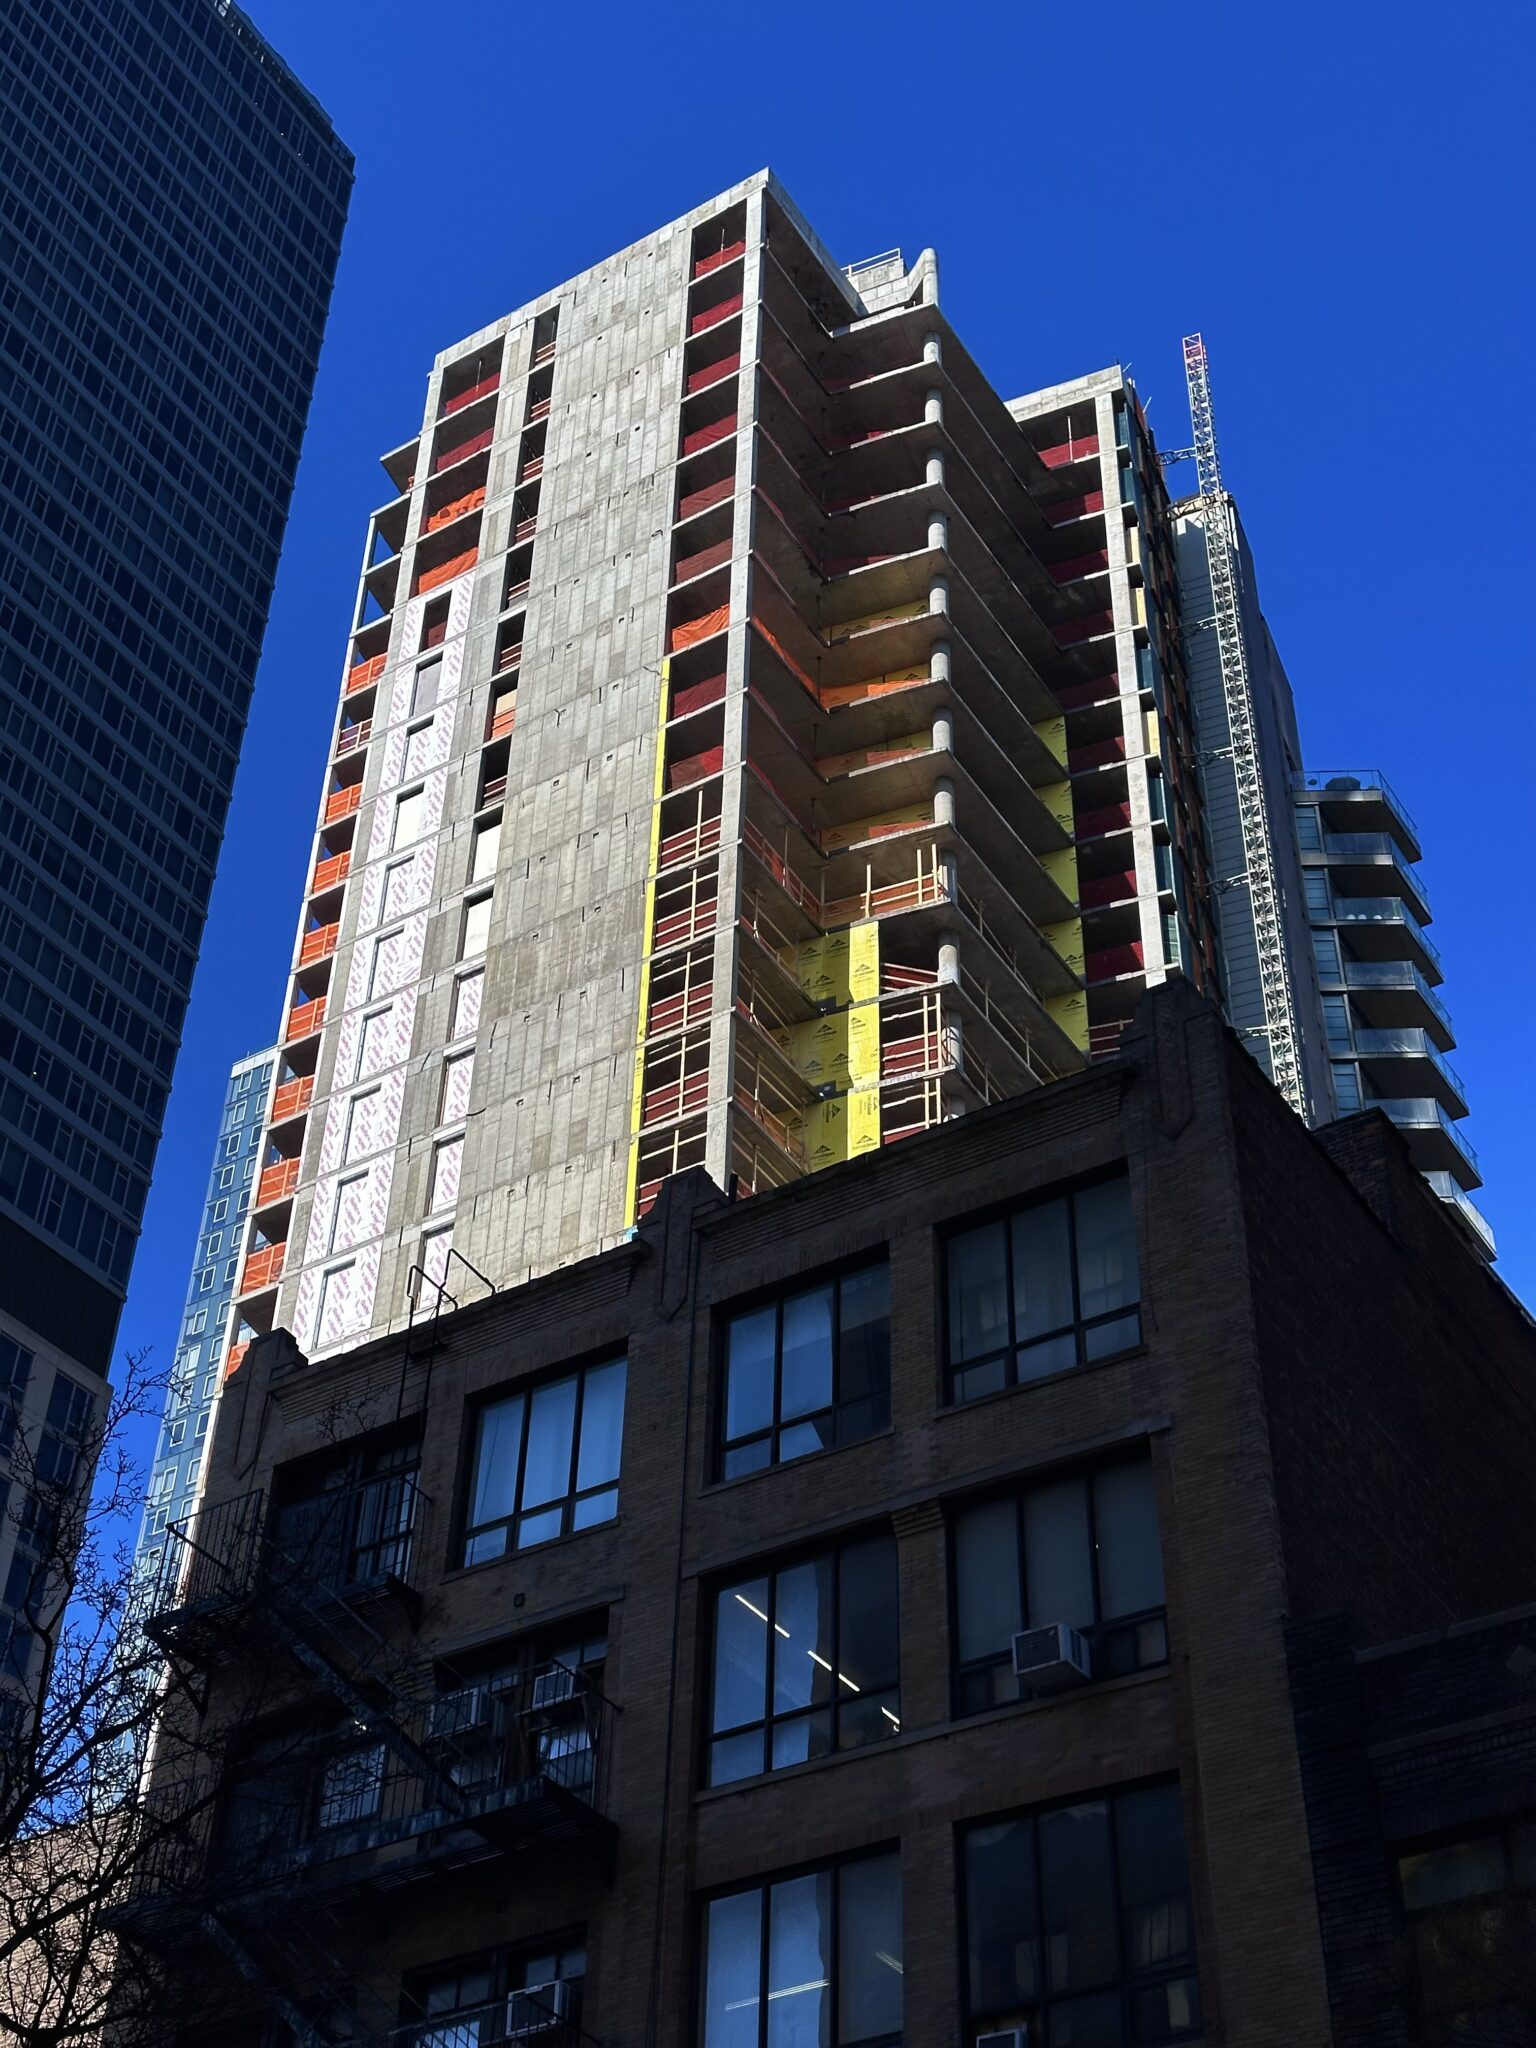
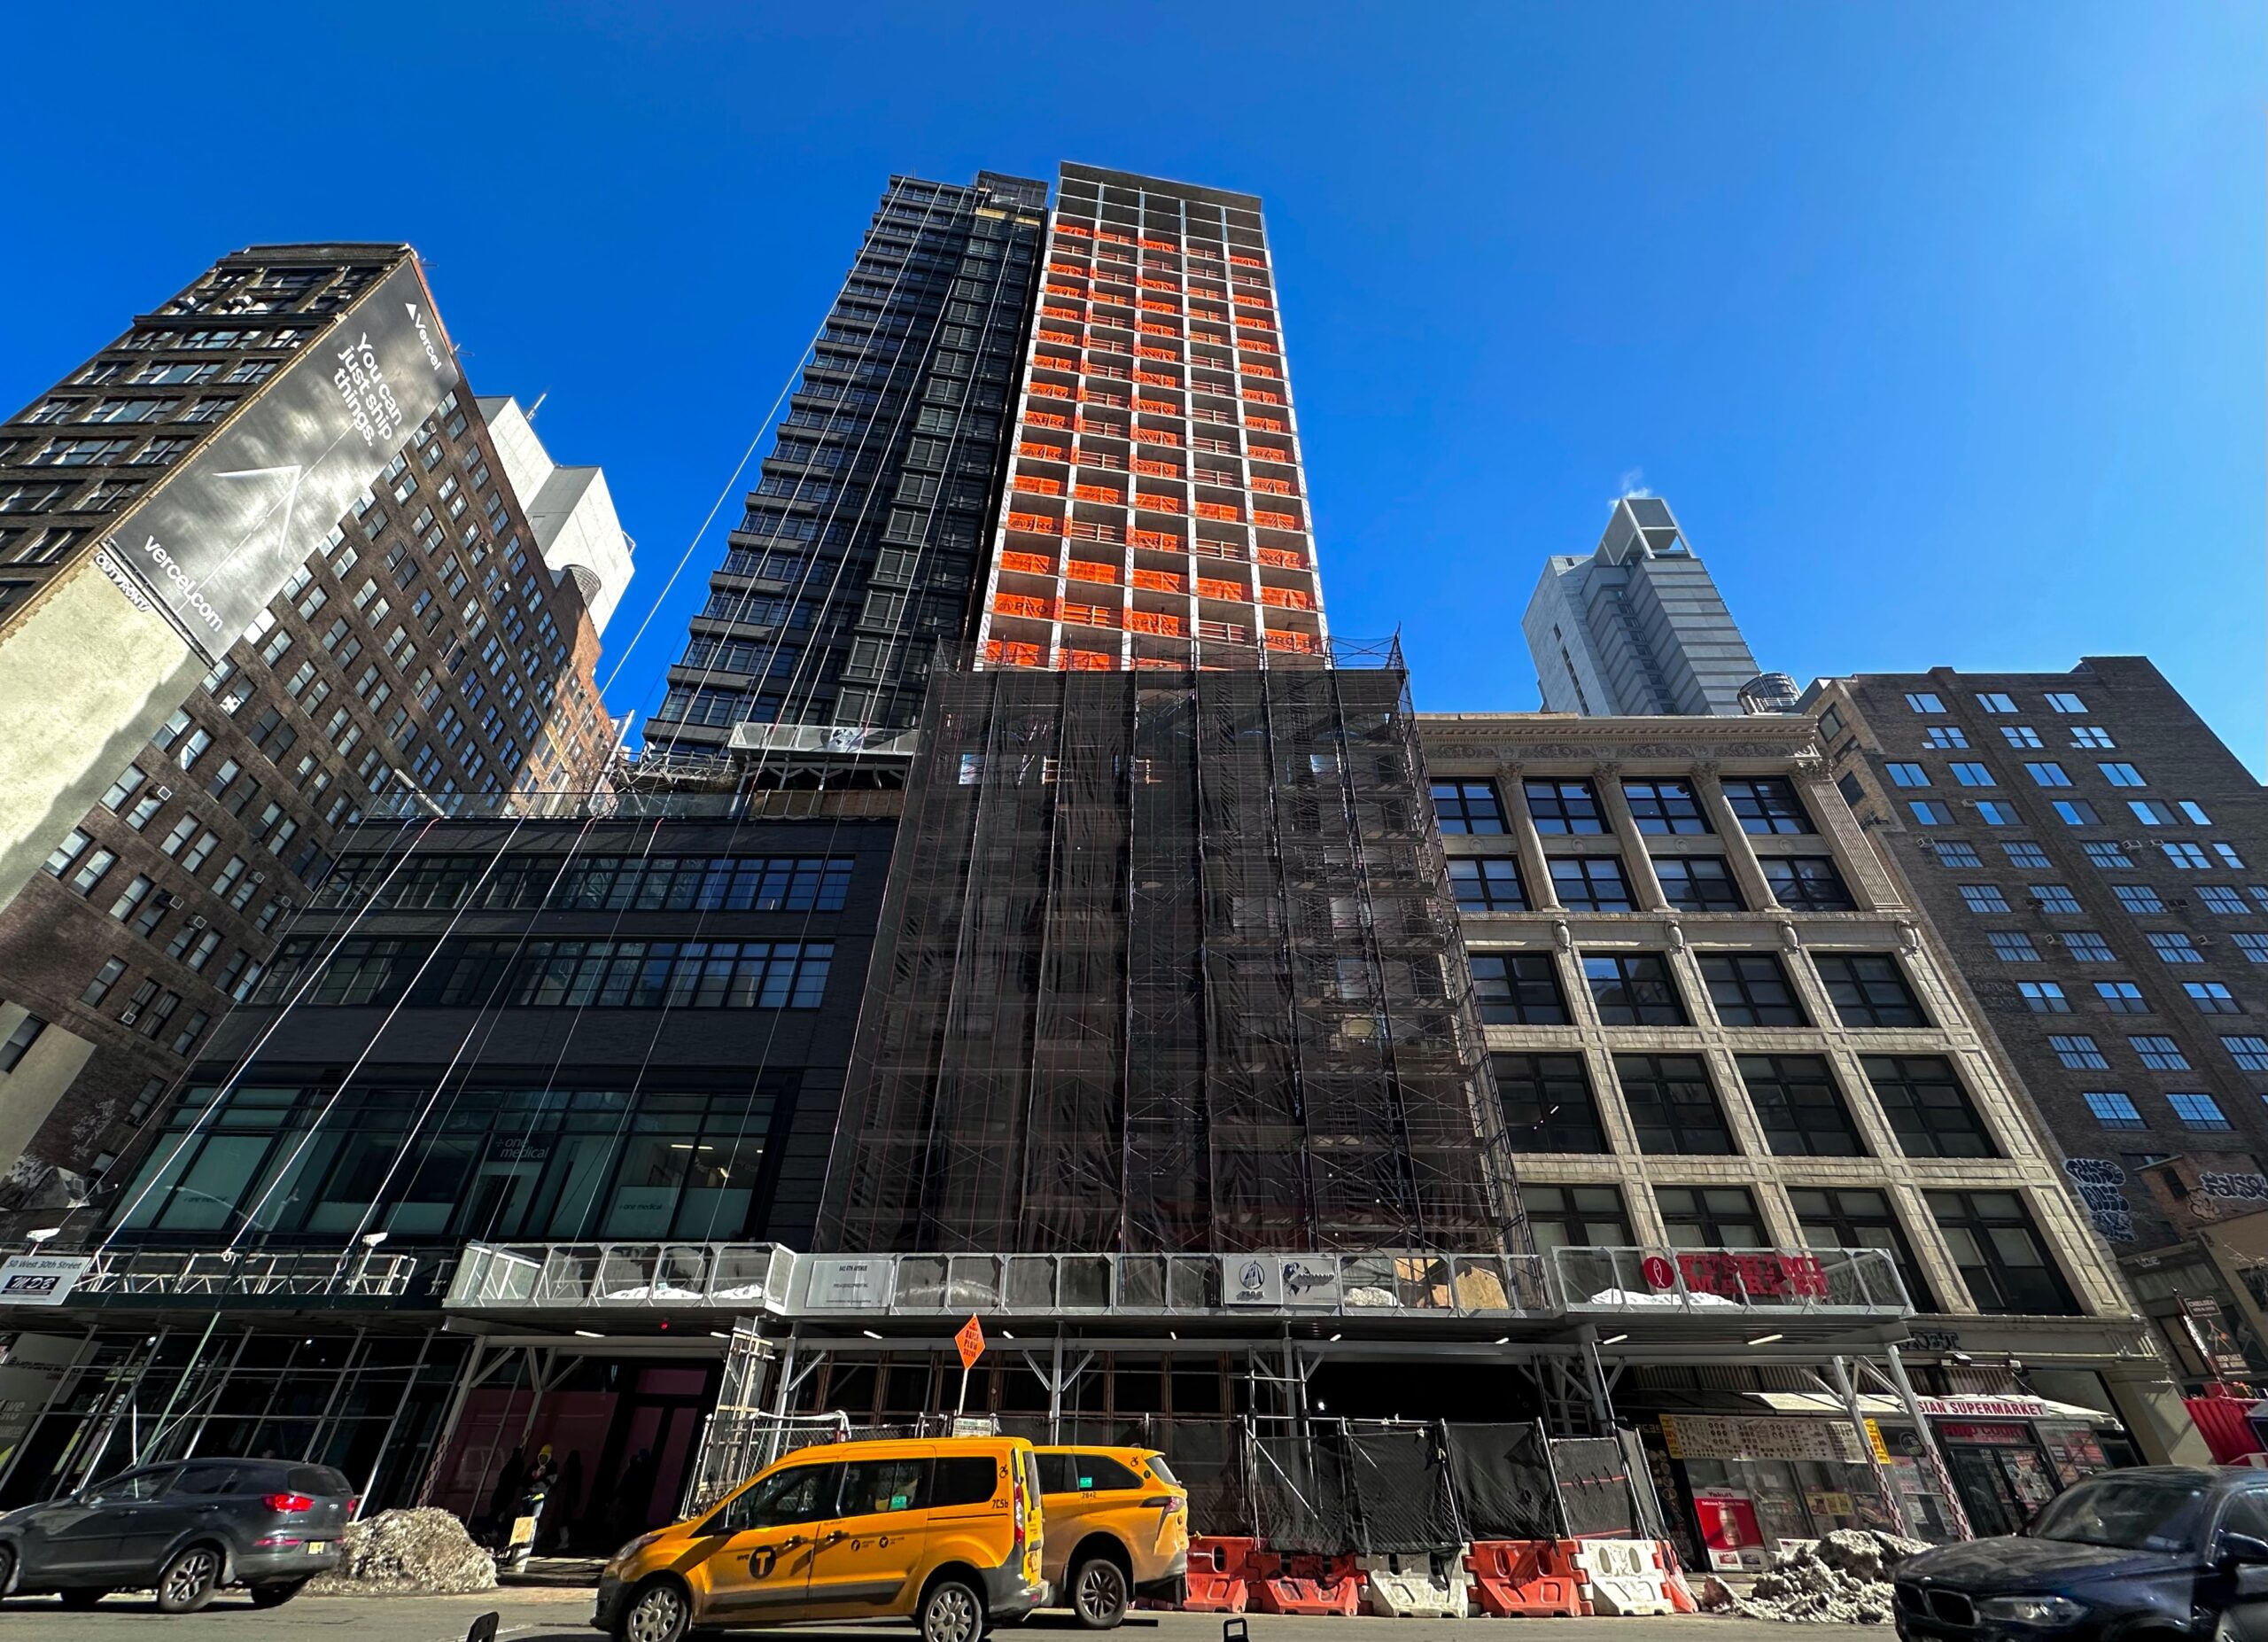
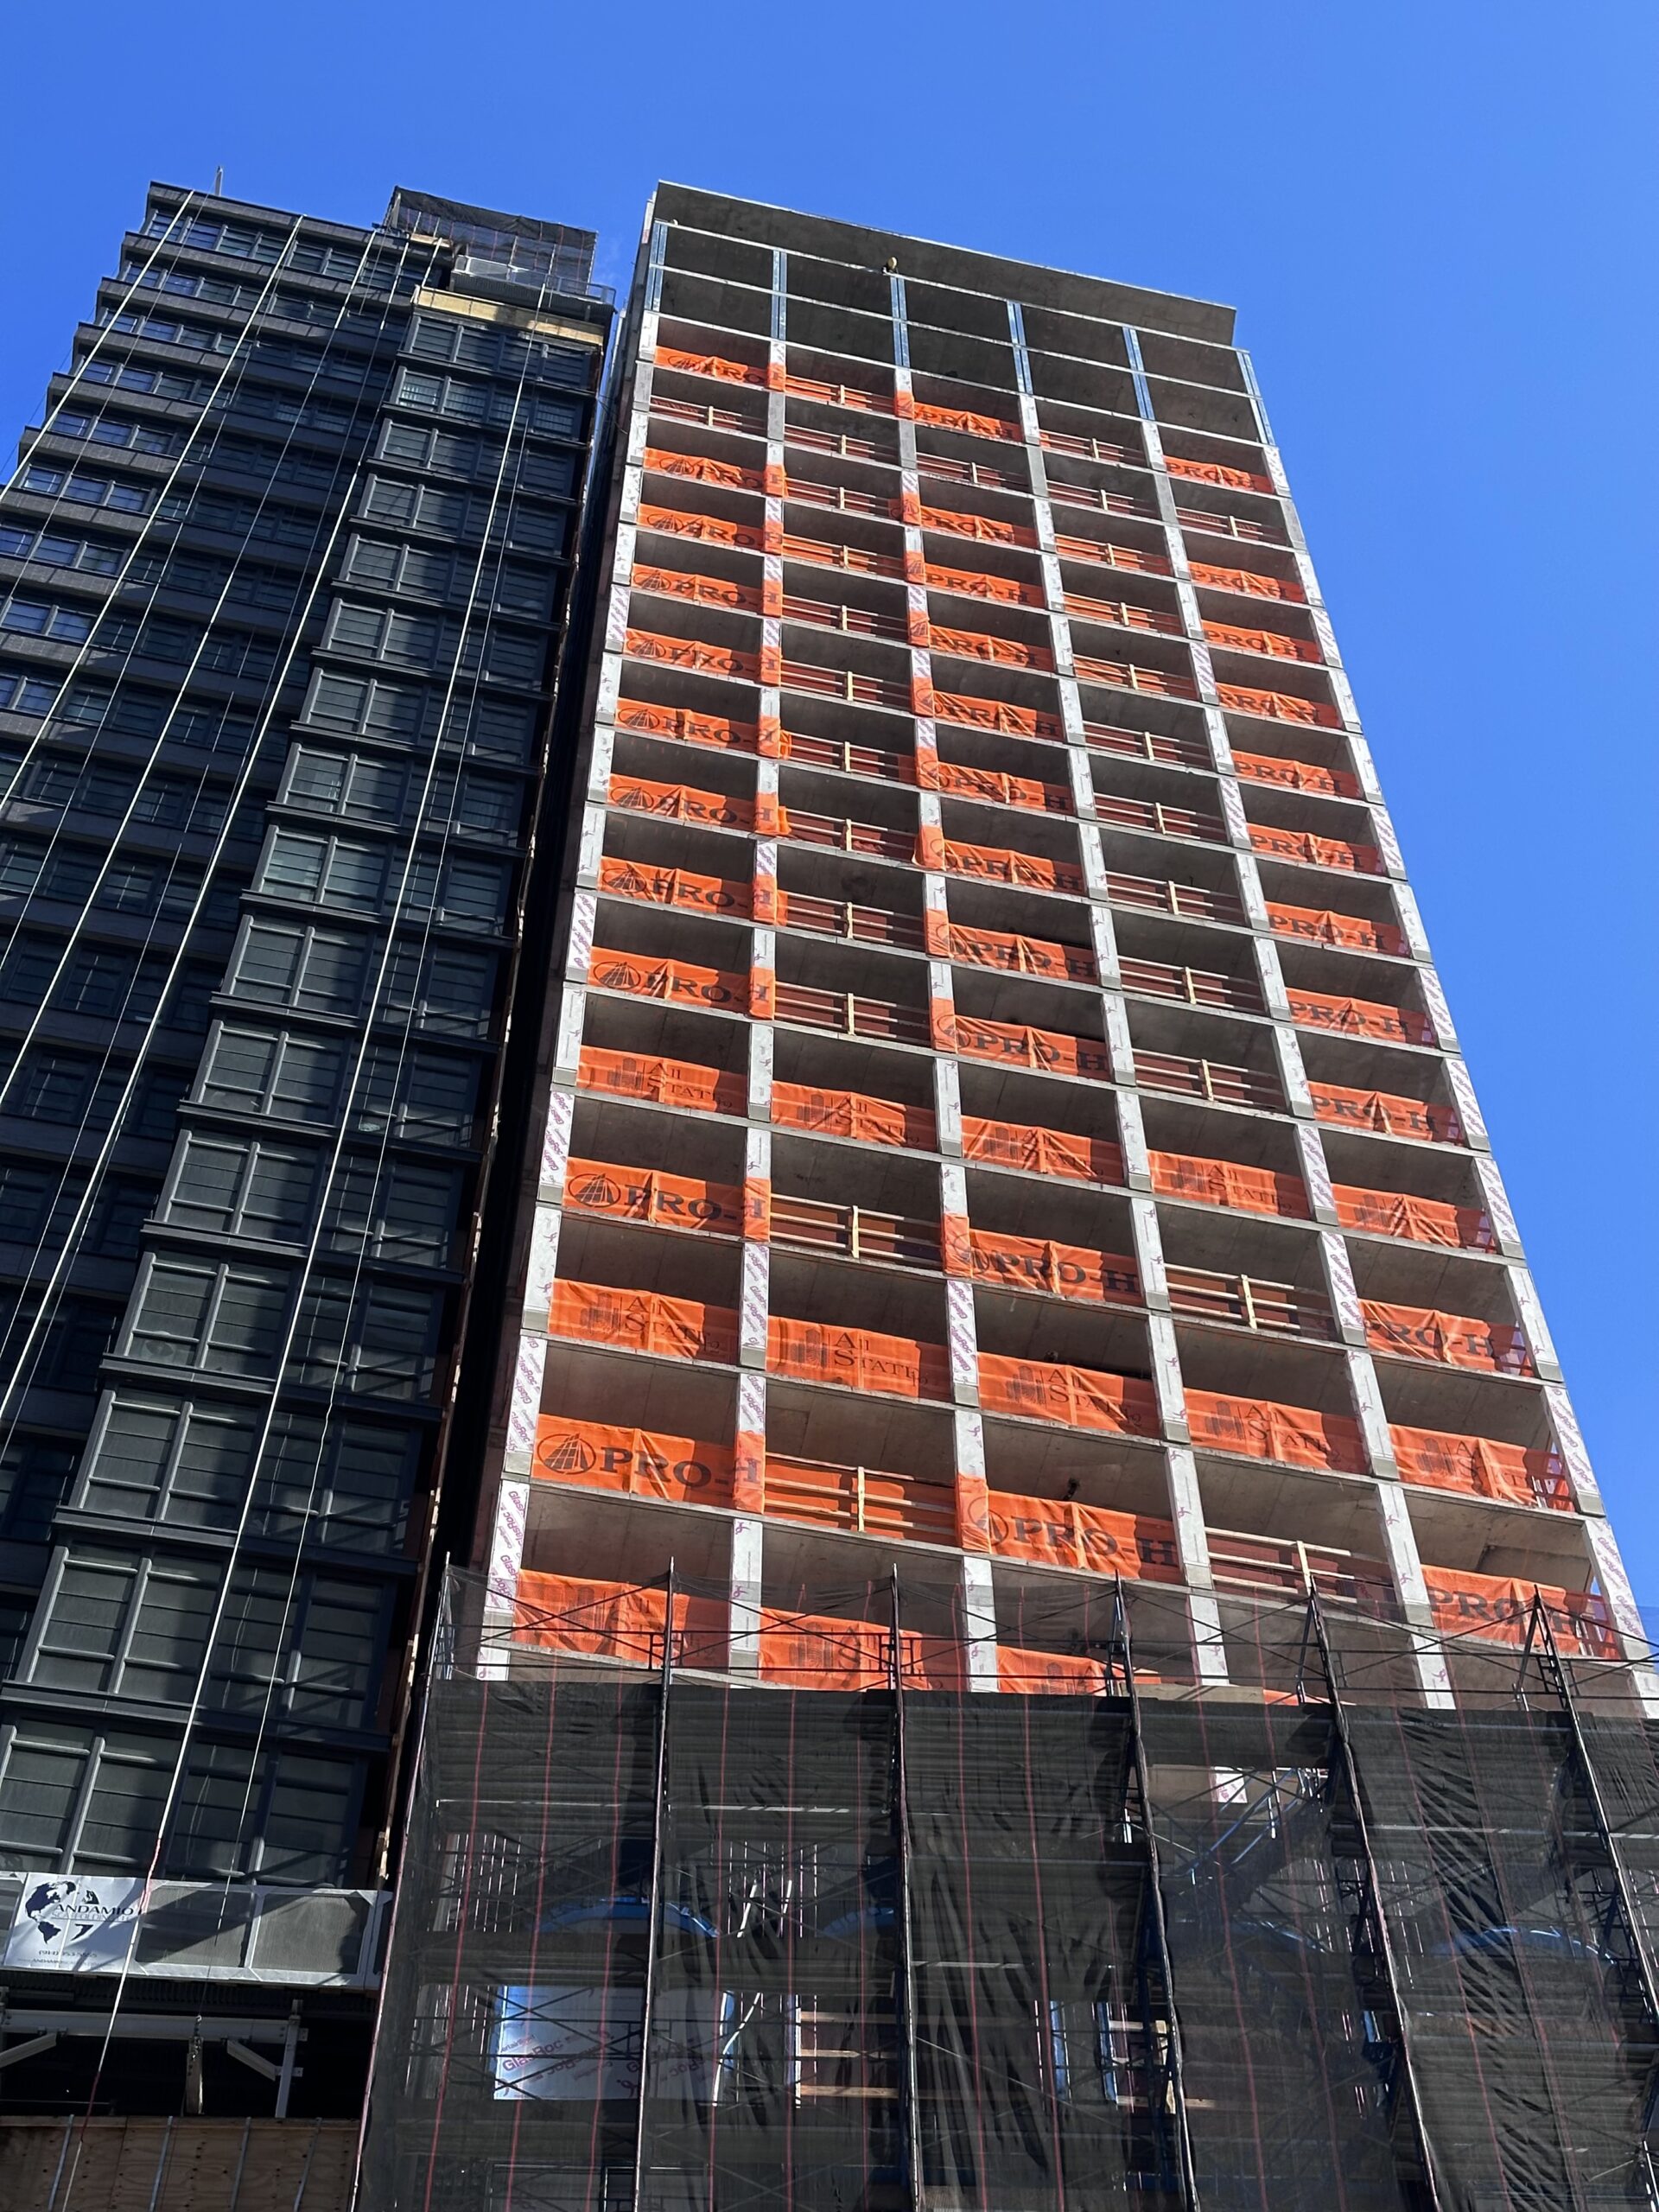
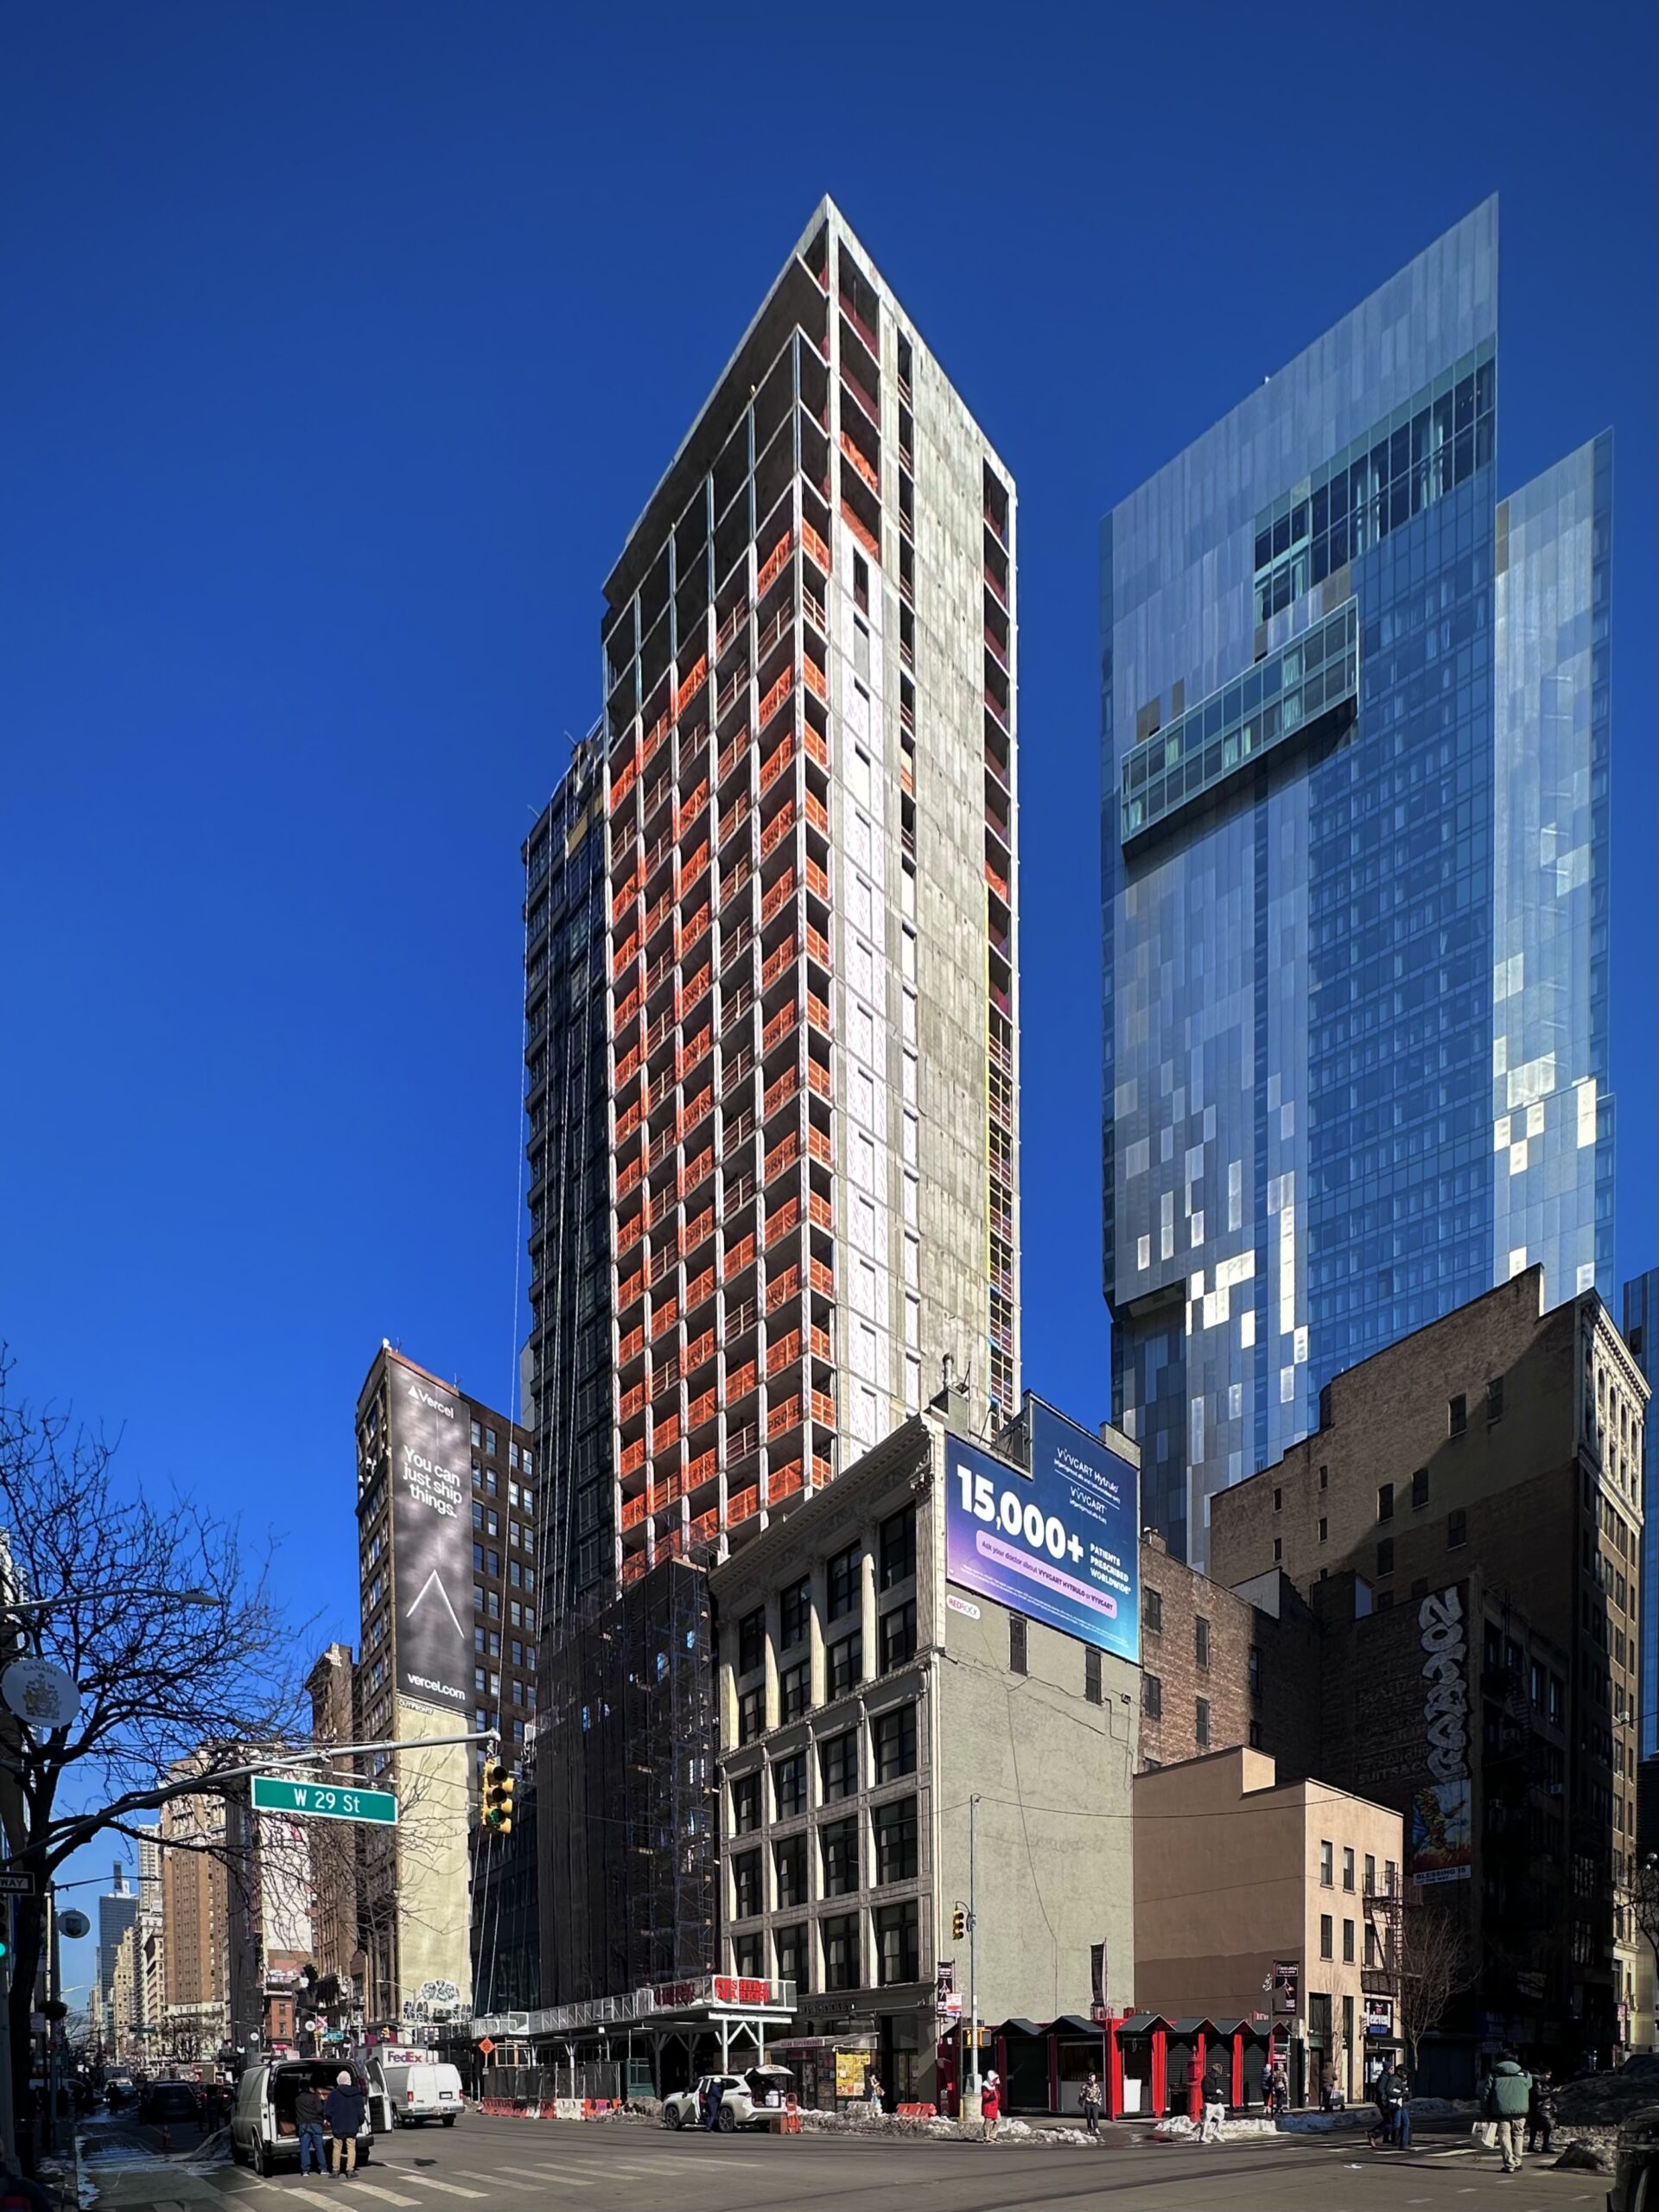
Construction has topped out on 842 Sixth Avenue, a 27-story residential tower in NoMad, Manhattan. Designed by Isaac & Stern Architects and developed by Pro-H Development, the 102,600-square-foot will yield condominium units and lower-level retail space. 842 Edenview LLC is listed as the owner of the property, which is located on an interior lot between West 29th and West 30th Streets. Robin Schneiderman of Brown Harris Stevens Development Marketing will lead sales and marketing.
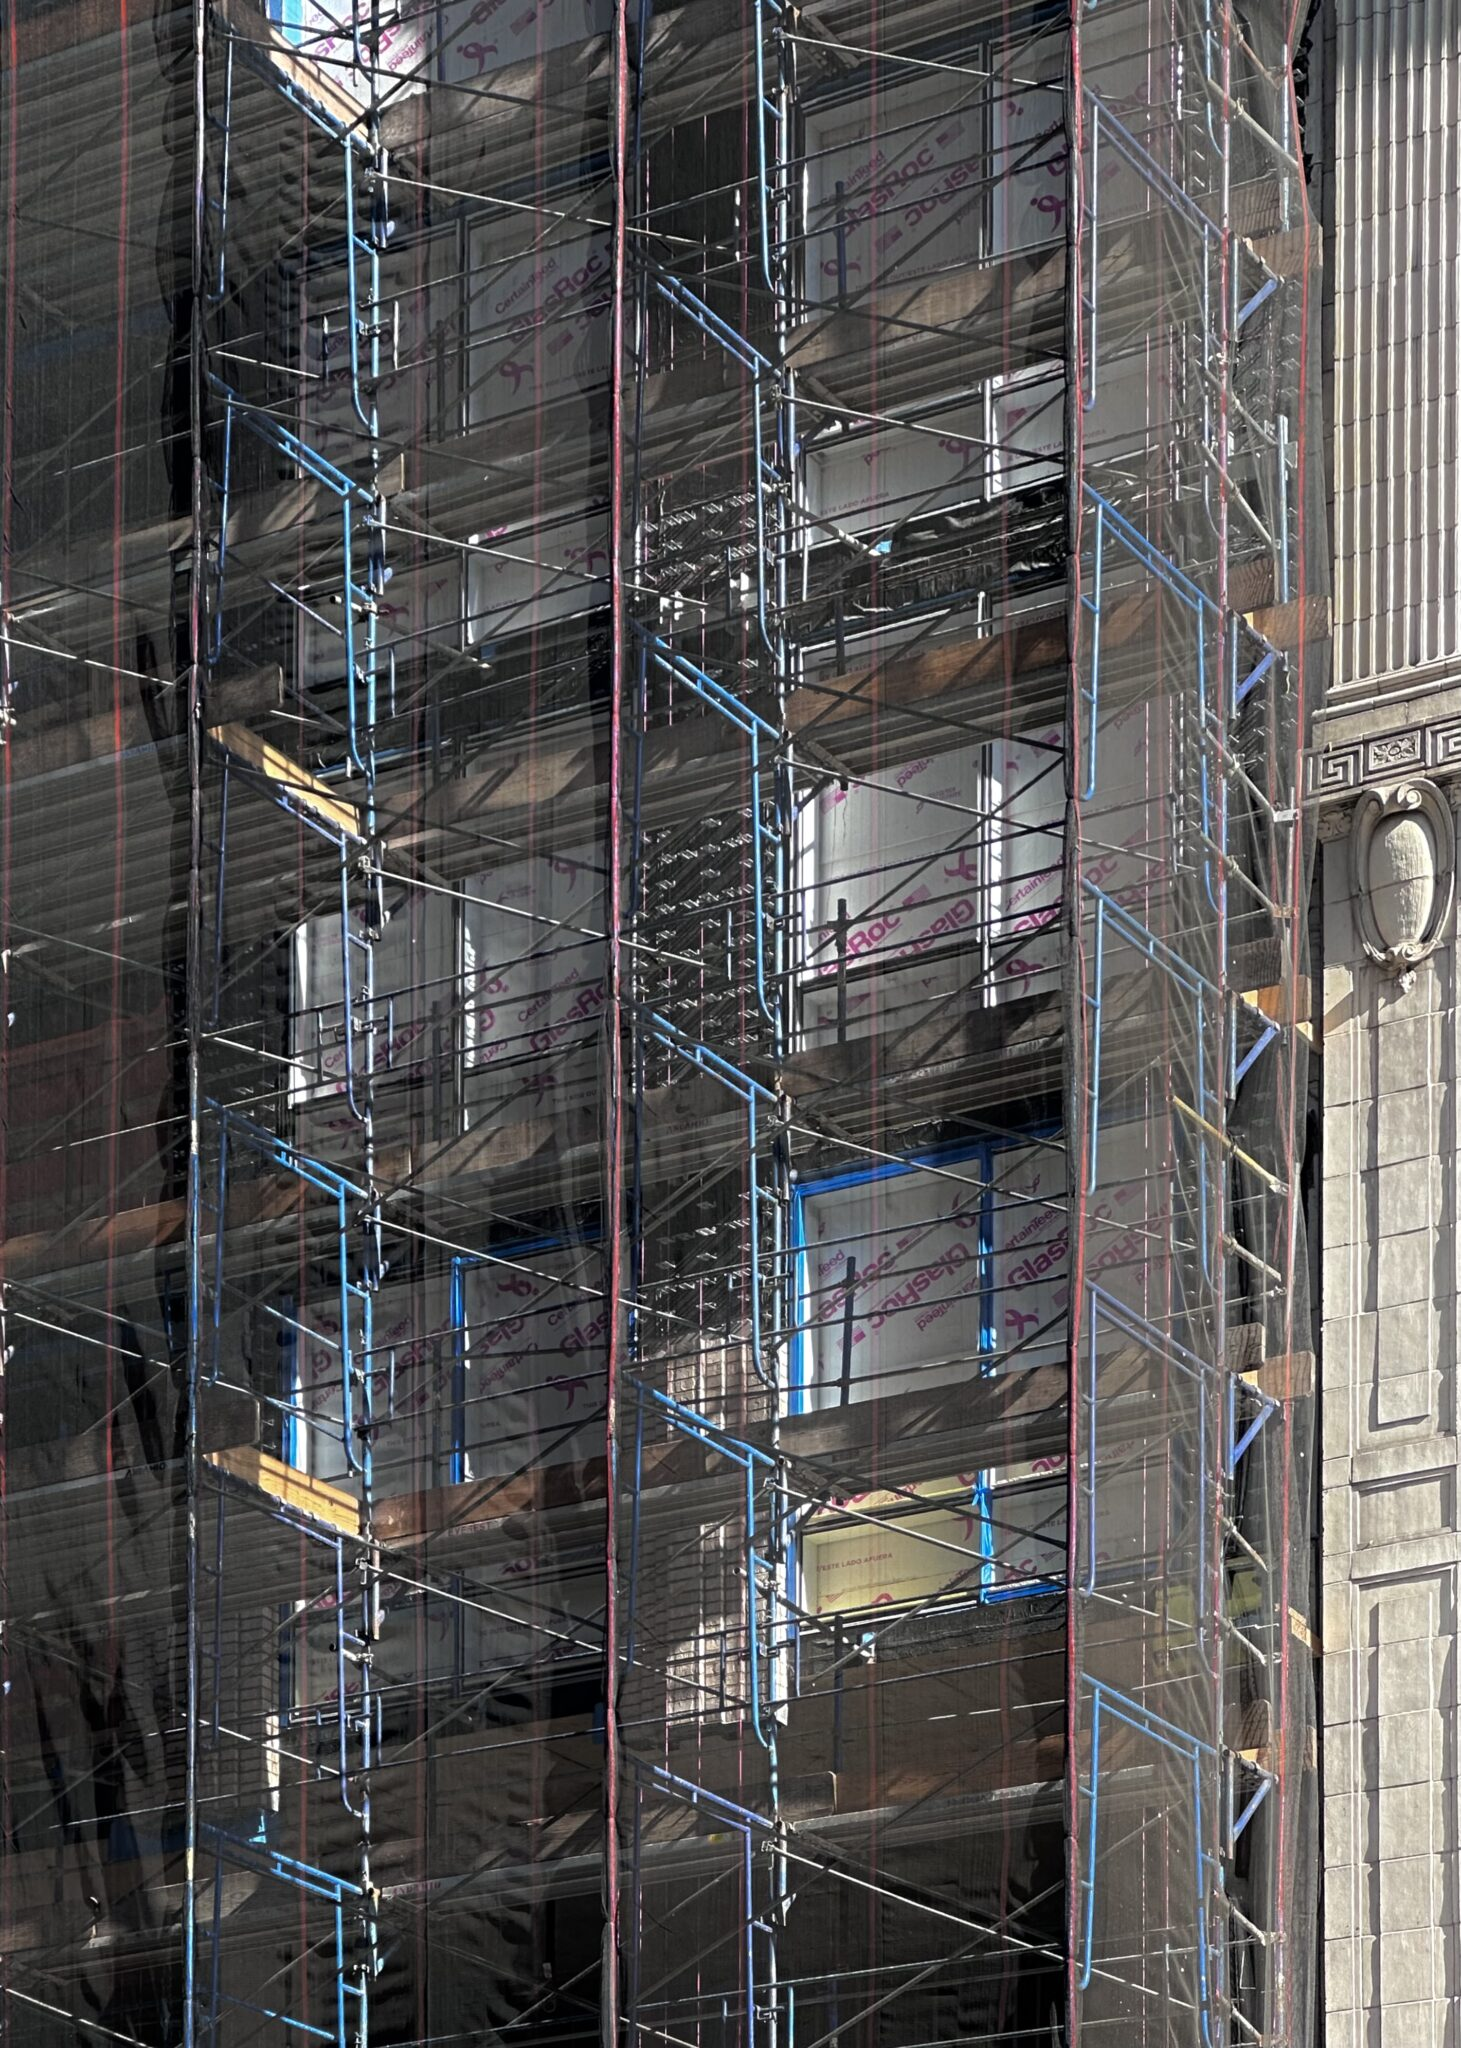
The entire reinforced concrete superstructure was built since our last update in May 2025, when only the foundations were complete. Scaffolding and netting cover the podium floors as crews work to install the light gray brick façade between the window voids.
842 Sixth Avenue. Photo Michael Young.
842 Sixth Avenue. Photo Michael Young.
842 Sixth Avenue. Photo Michael Young.
842 Sixth Avenue. Photo Michael Young.
842 Sixth Avenue. Photo Michael Young.
842 Sixth Avenue. Photo Michael Young.
842 Sixth Avenue. Photo Michael Young.
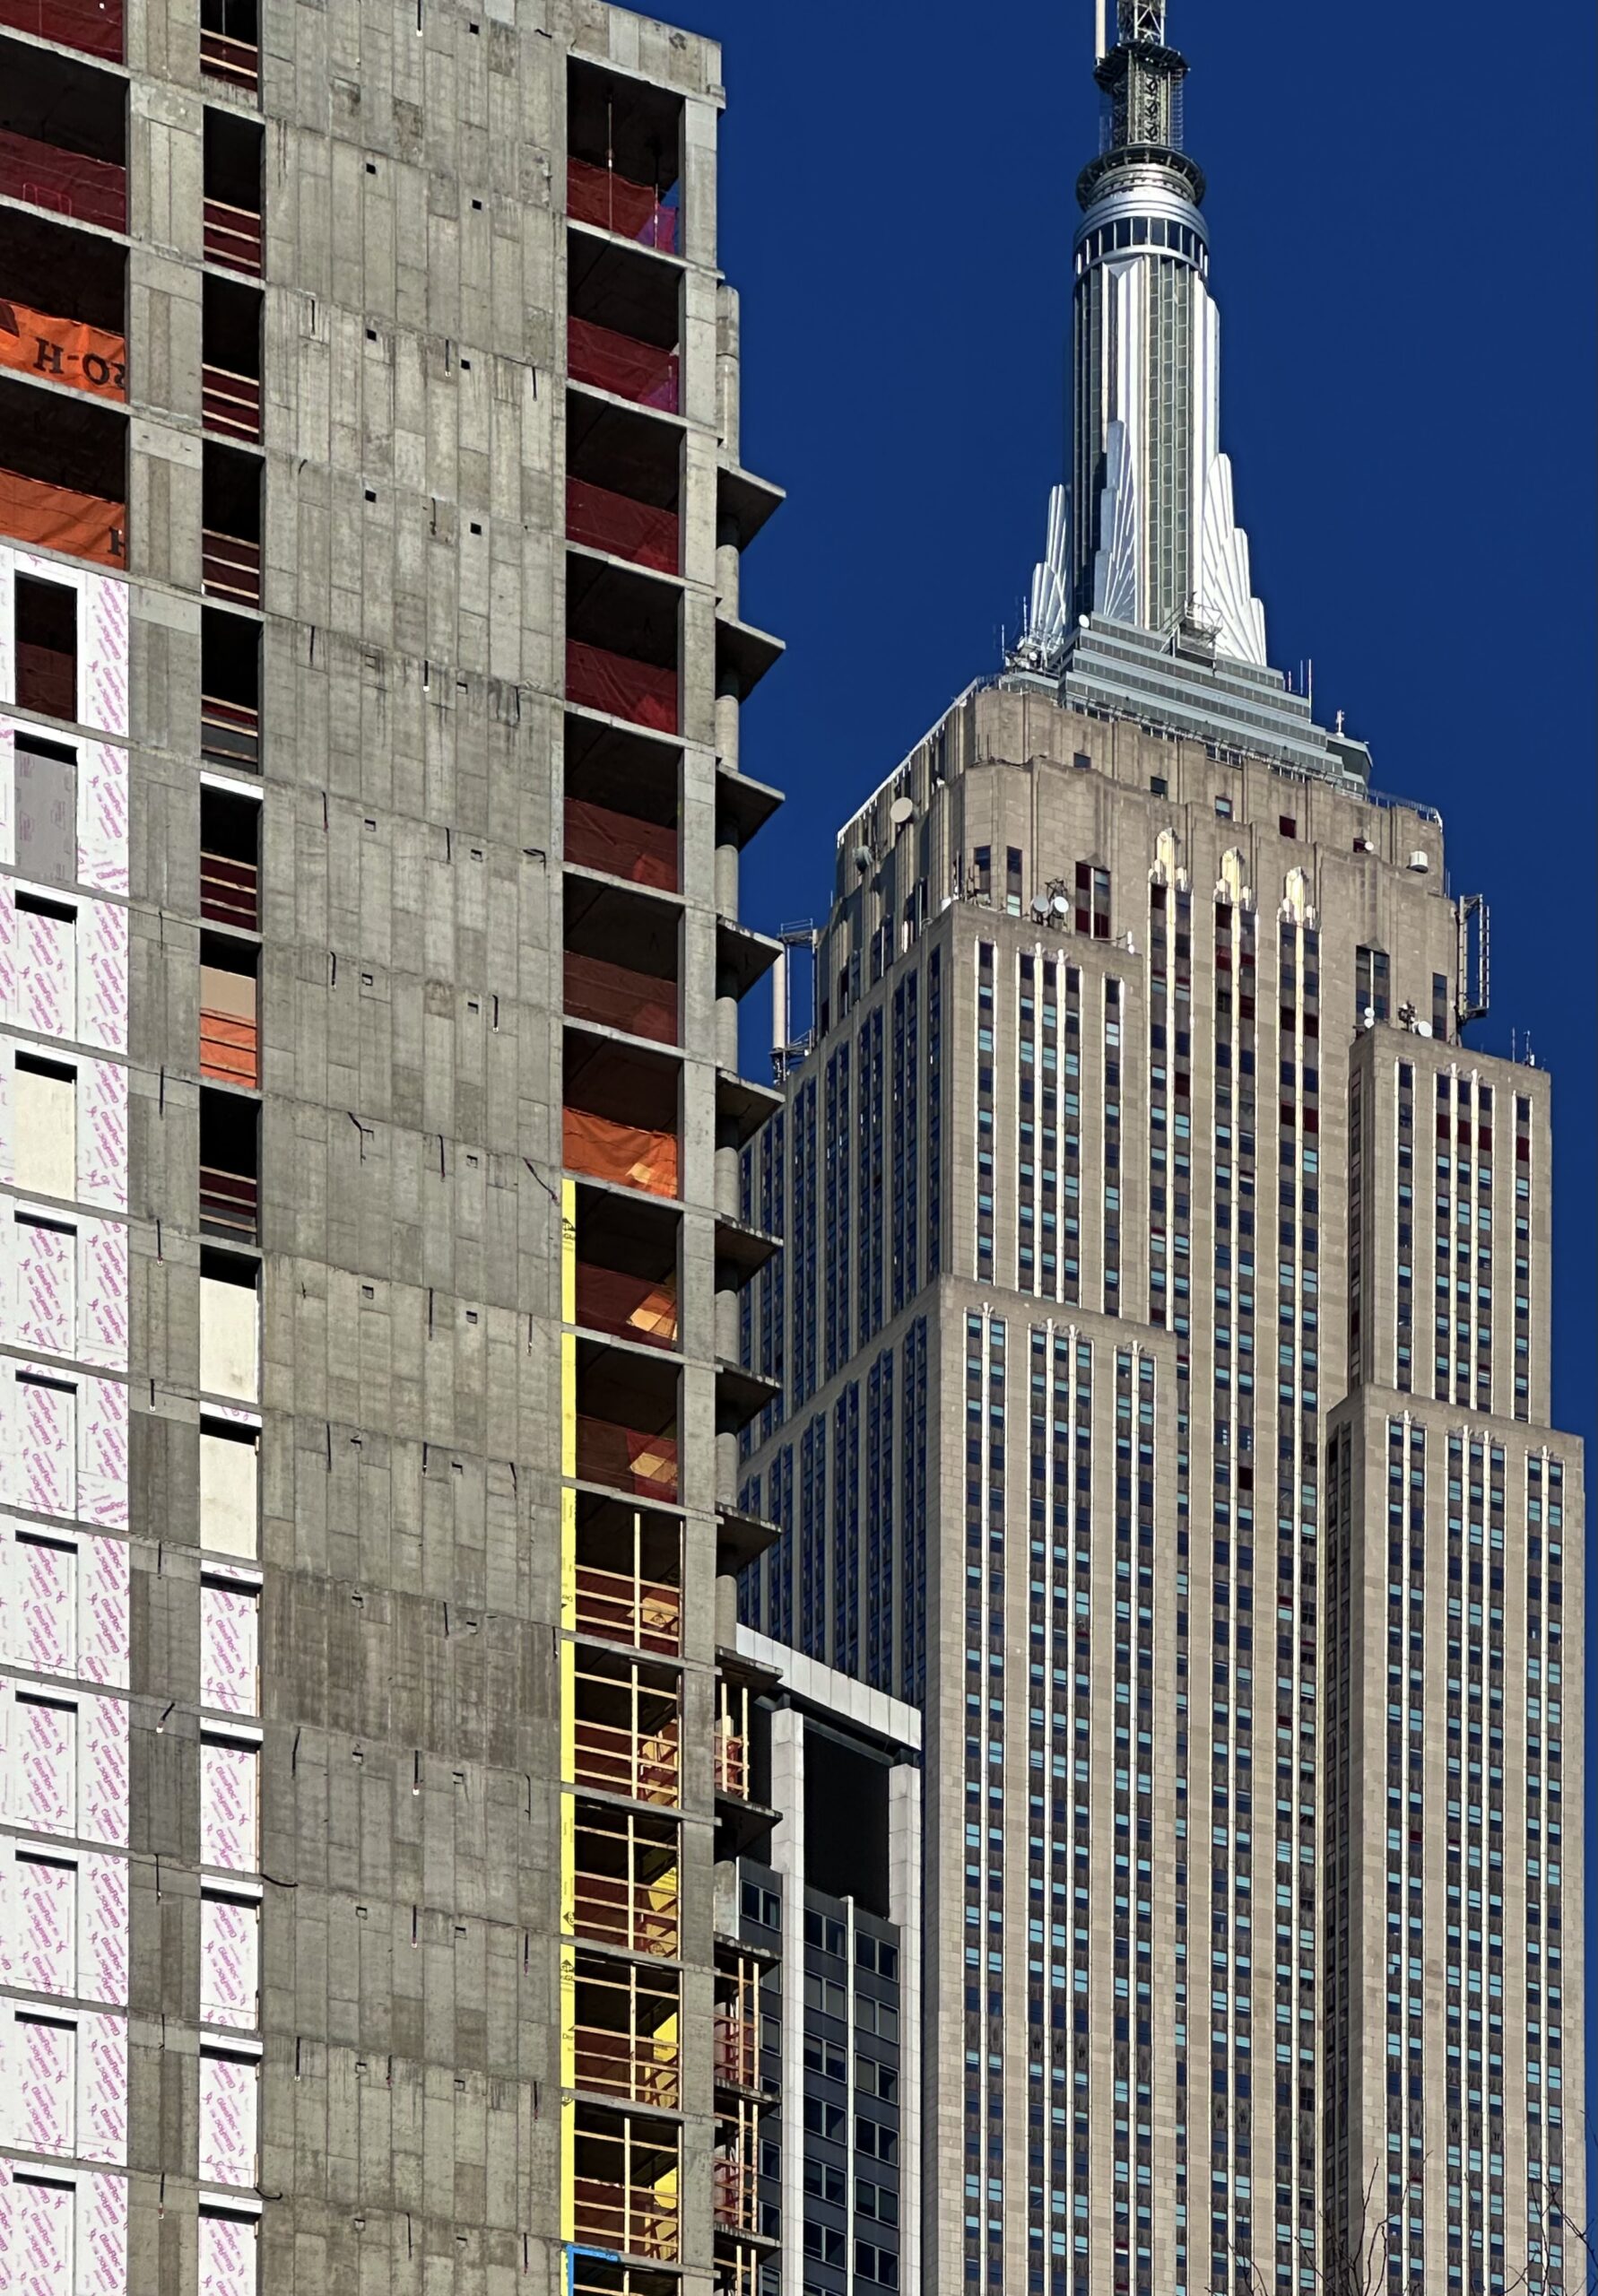
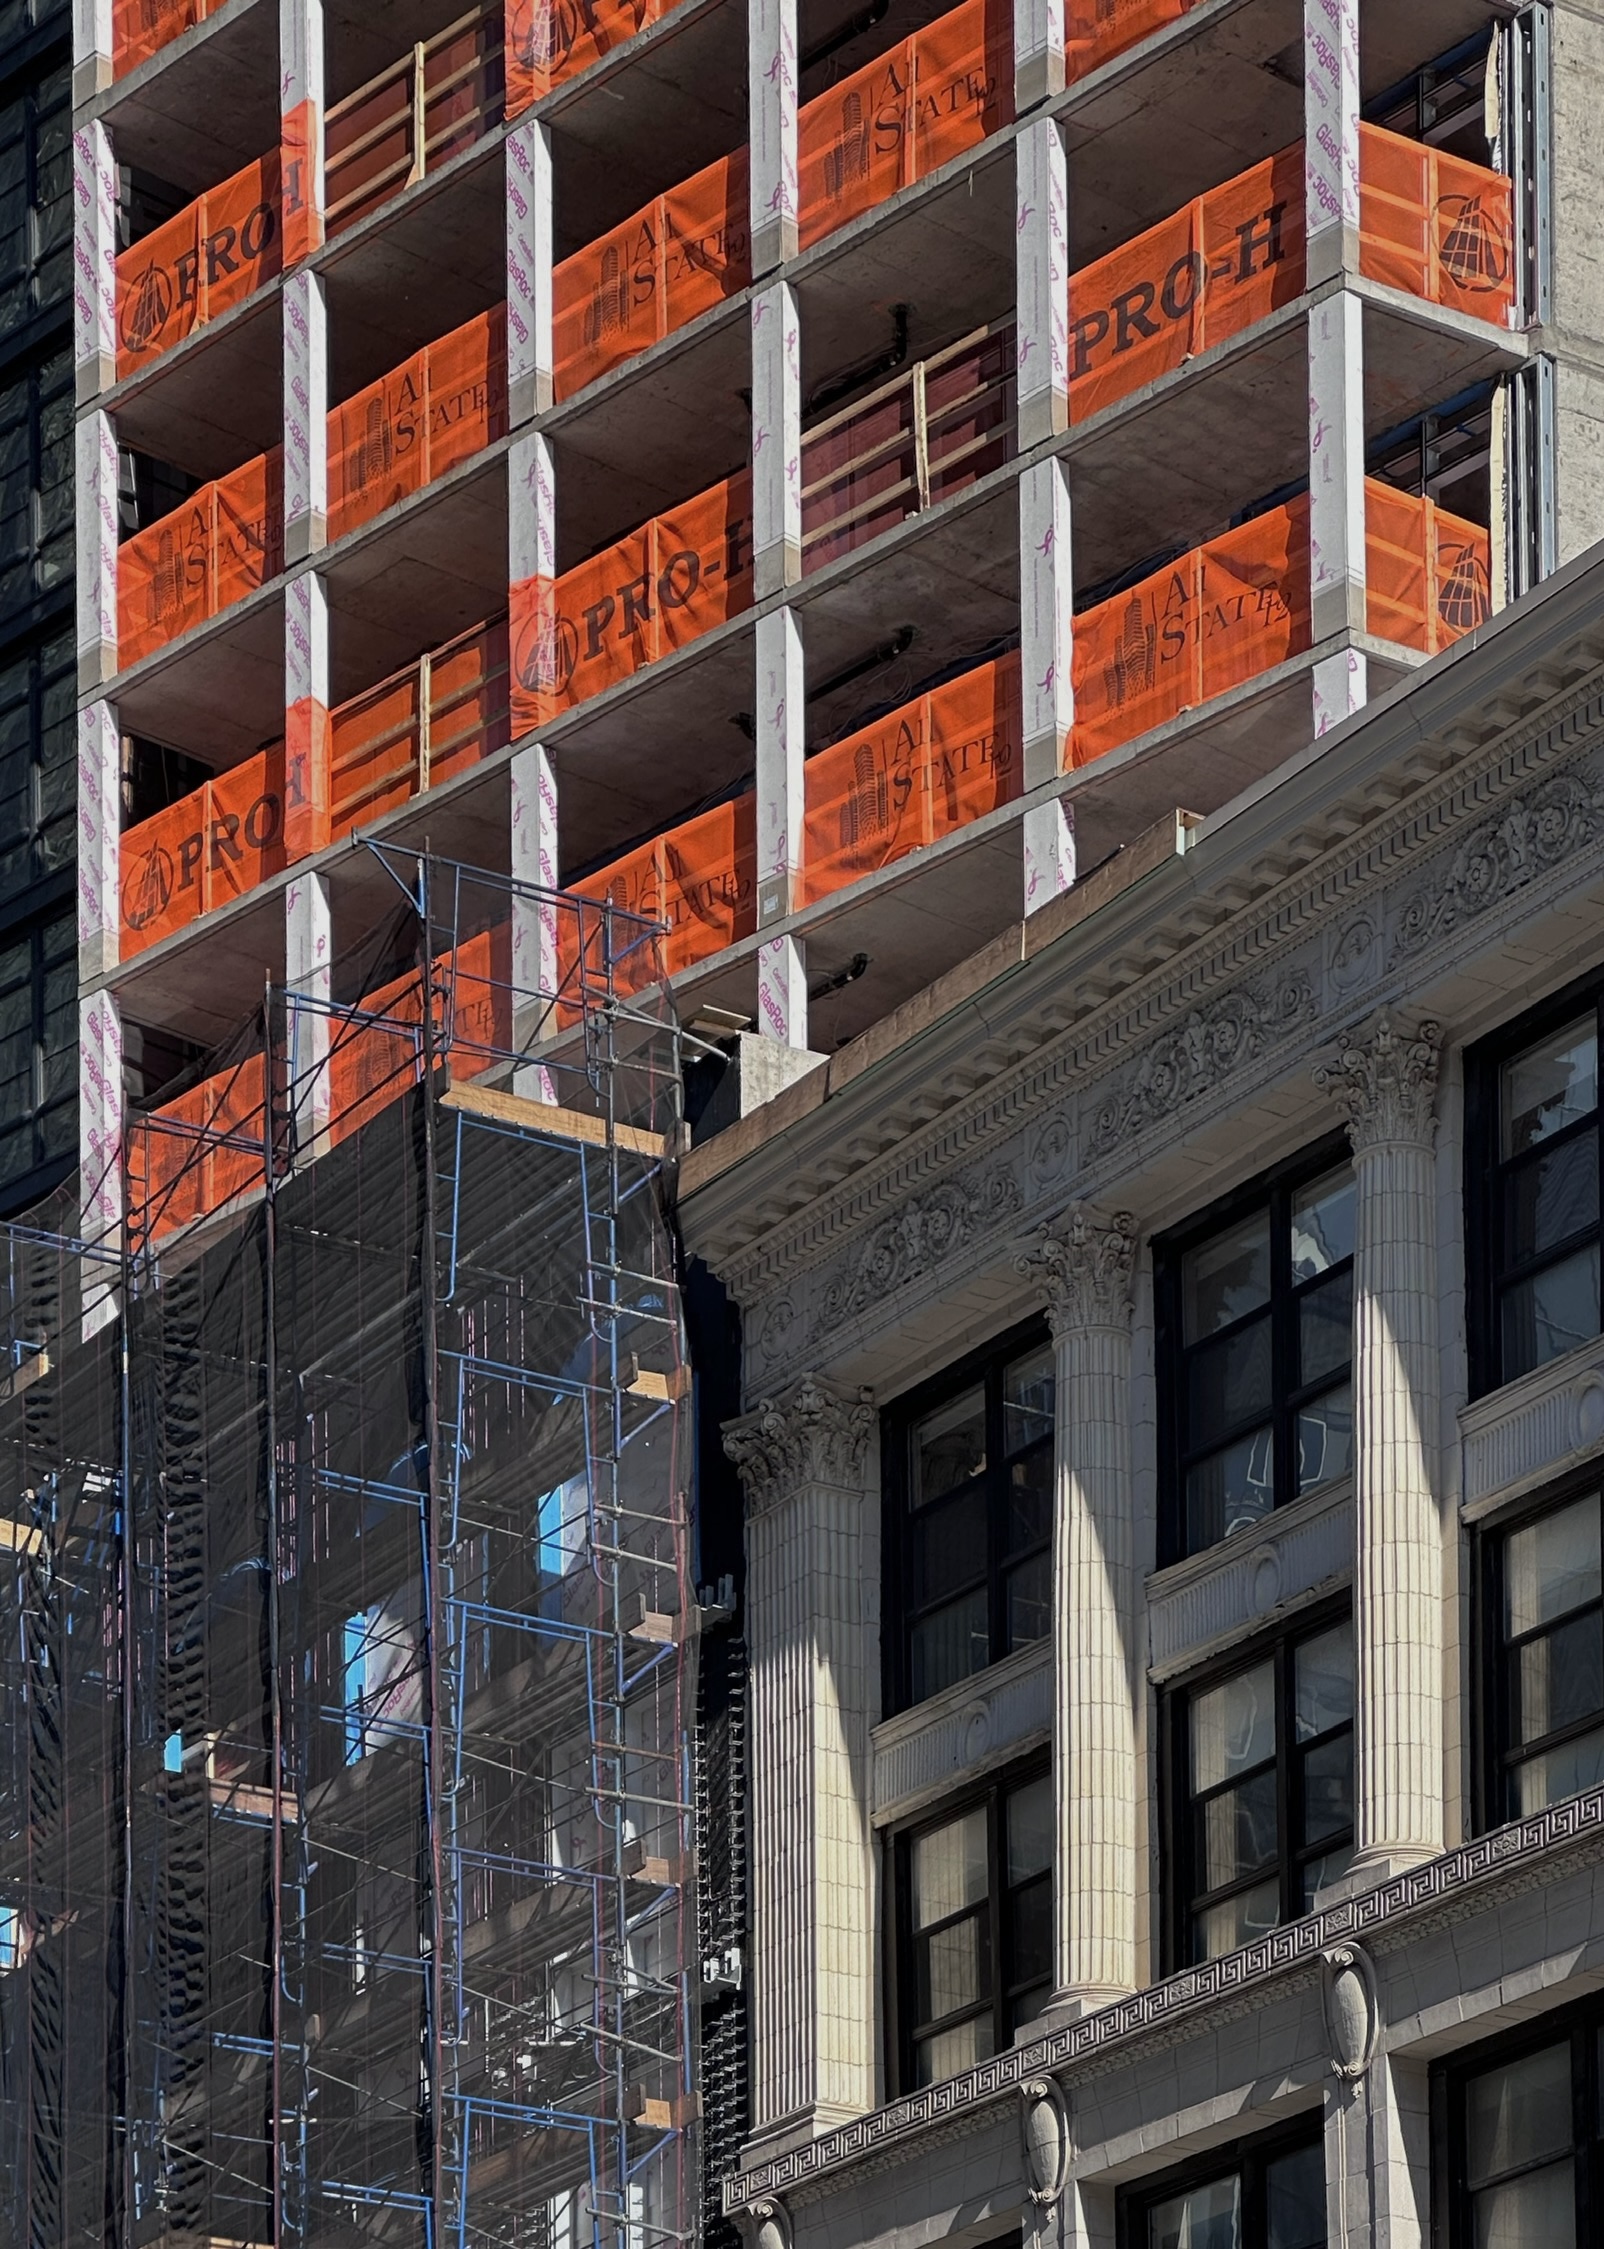
The brick façade is visible near the bottom of the following close-up shot.
842 Sixth Avenue. Photo Michael Young.
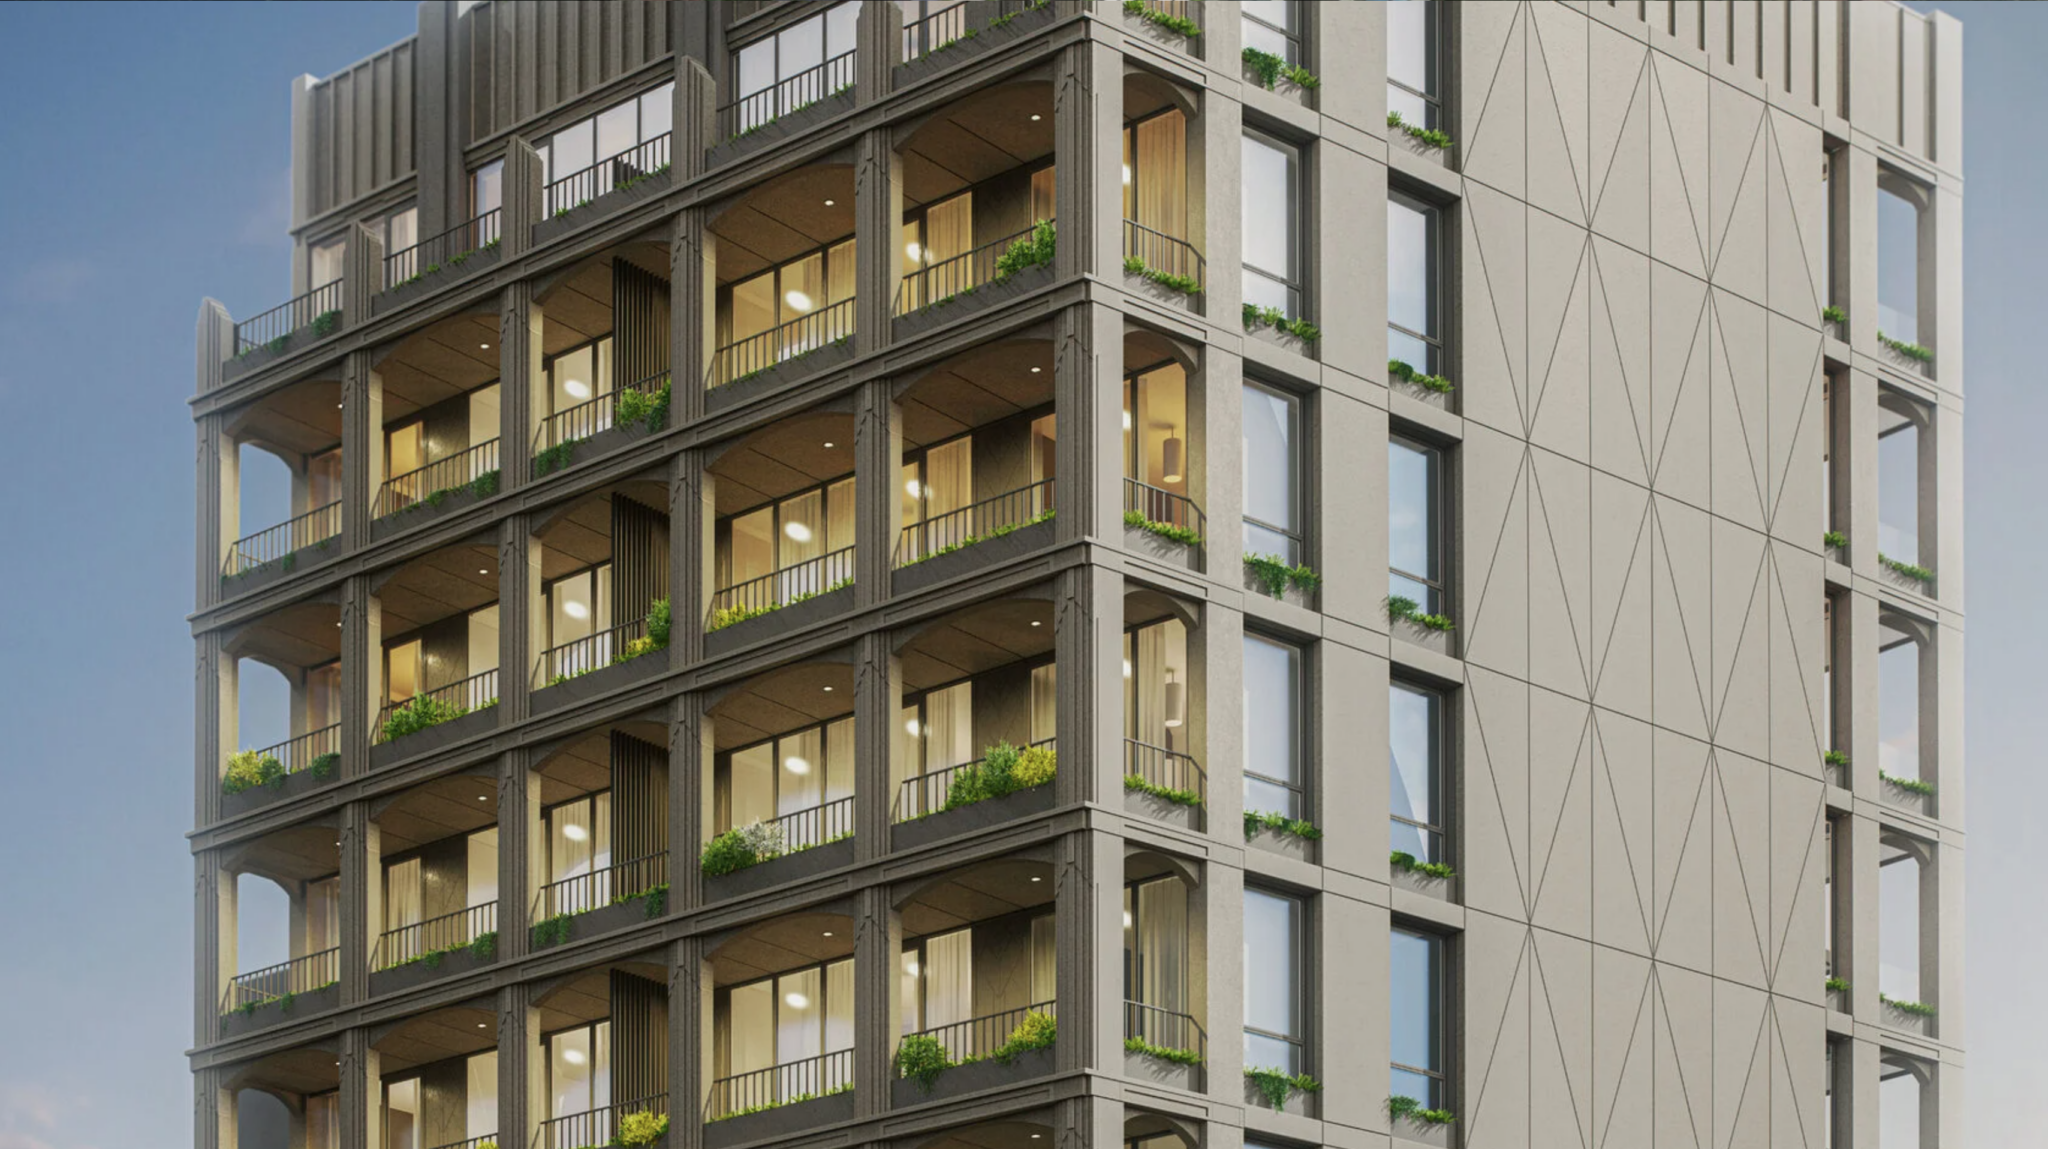
The renderings in the main photo and below preview the front and rear faces lined with loggia balconies. The visible southern lot line wall will be left mostly blank and etched with a geometric pattern, and the building will culminate in a crown with vertical ridges.
842 Sixth Avenue. Designed by Isaac & Stern Architects
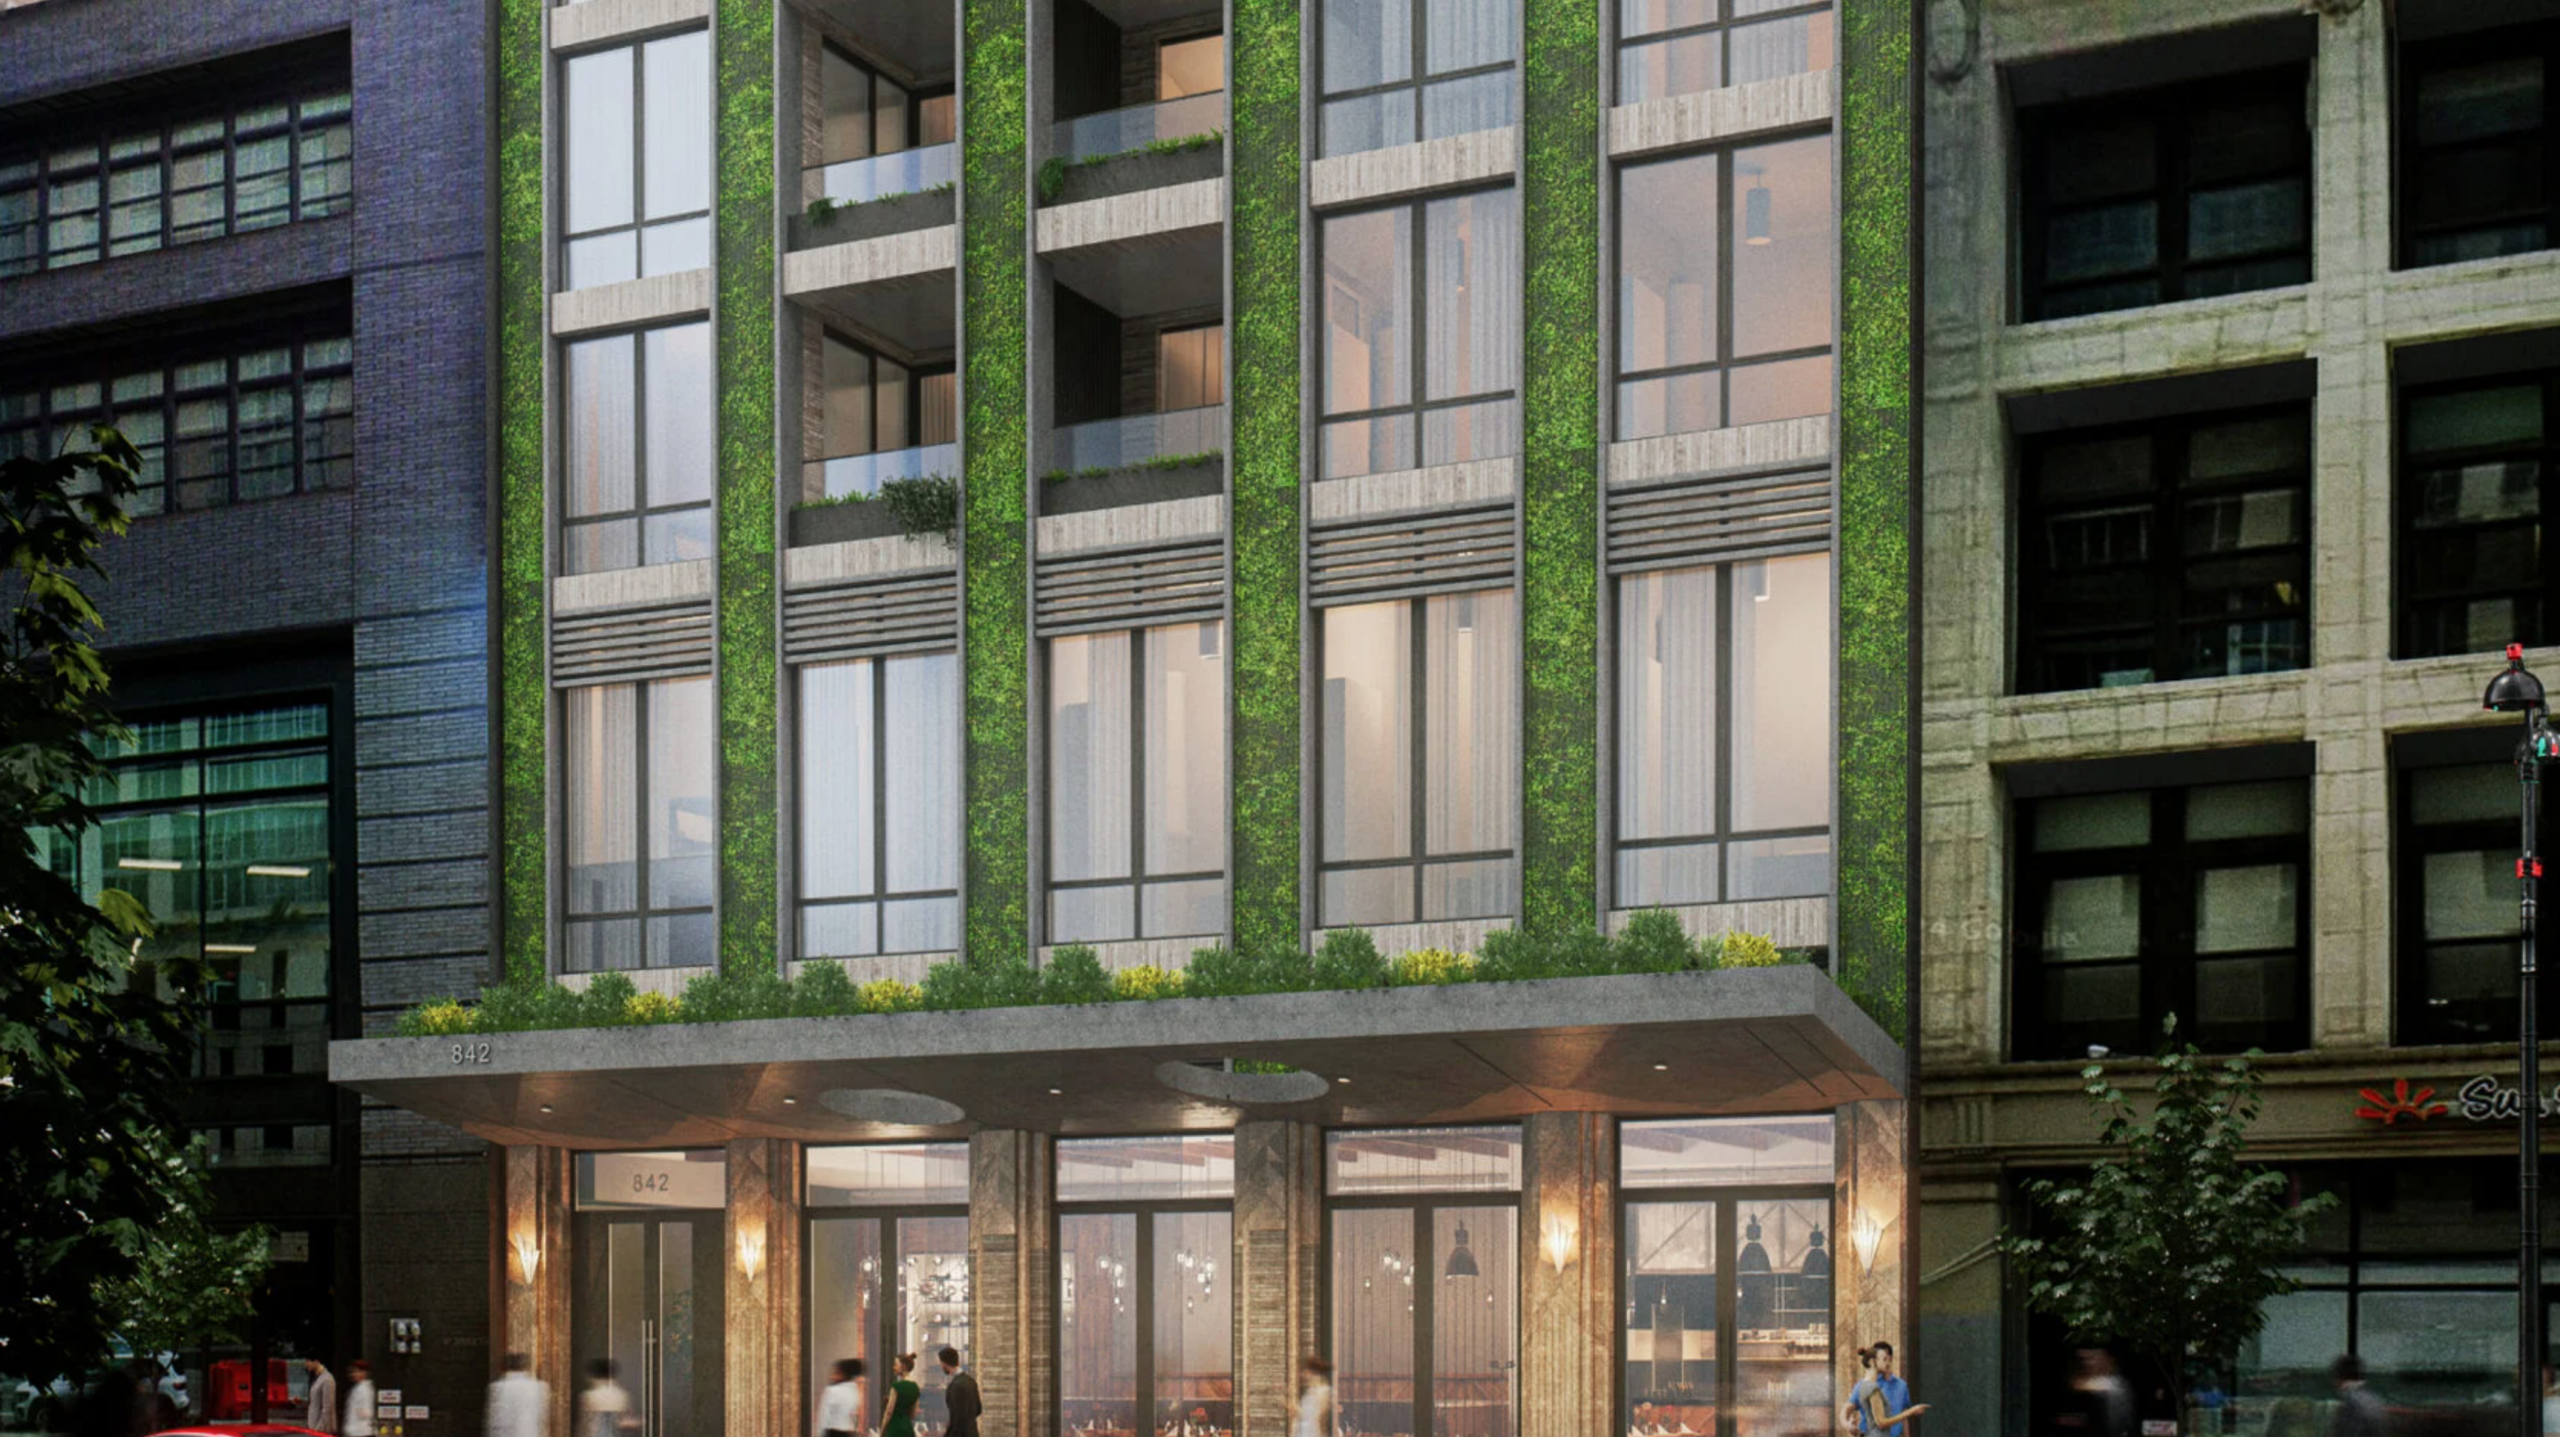
The following rendering offers a closer look at the base, which will feature hanging vegetation on the columns between the grid of floor-to-ceiling windows, as well as additional loggia balconies. The sloped sidewalk canopy will feature two circular cutouts and will be topped with low shrubbery.
842 Sixth Avenue. Designed by Isaac & Stern Architects
The tower was built on the existing foundations for the cancelled 26-story AC NoMad Hotel, which was planned to become the tallest modular hotel in the world. Work stalled in 2020 just before construction reached street level. Hung Pin Hung’s Brooklyn-based Pro-H Development then purchased the property in 2024 for $30 million after former developer Robert Chun defaulted on the project’s debt, according to The Real Deal.
The below rendering depicts the outdated plan for the AC NoMad Hotel, which would have yielded 168 rooms operated by Marriott.
Rendering of AC NoMad Hotel at 842 Sixth Avenue. Designed by Danny Foster & Architecture
The nearest subways from the development are the B, D, F, M, N, Q, R, and W trains at the 34th Street–Herald Square station to the north, which also offers access to the PATH train to New Jersey
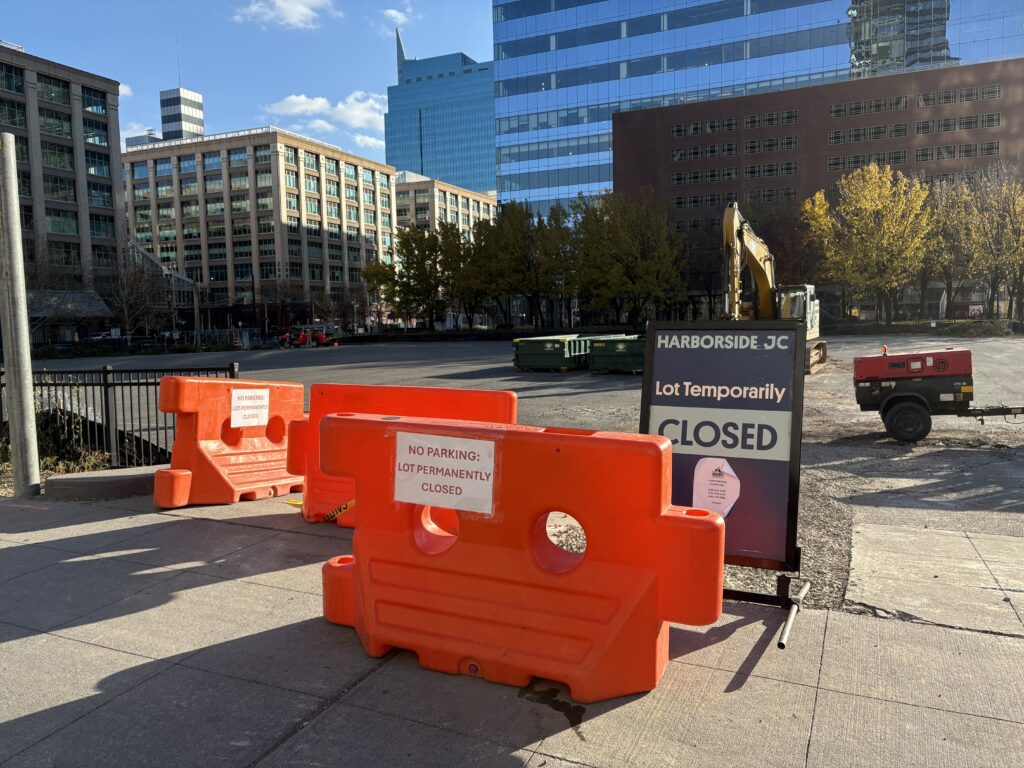
A parking lot that will be home to a two-tower development has officially closed over three years after new development was approved for the site. Photo by Chris Fry/Jersey Digs.
What was slated to be the second phase at one of Jersey City’s largest redevelopments looks like it is finally moving forward as the project formally known as phase two of Urby looks like it will be rising a block from the waterfront.
The surface parking lot at 200 Greene Street is officially closed to the public, and some early excavation work underway at the site. The block is approved for a two-tower joint venture between Ironstate Development and Roseland Residential Trust.
The most recent version of the Urby plans were approved in 2024, but the development has lost its friend. The first tower in the Urby development, which sits across the street and came online in 2017, was rebranded as Sable following the property’s sale to Veris Residential earlier this year.
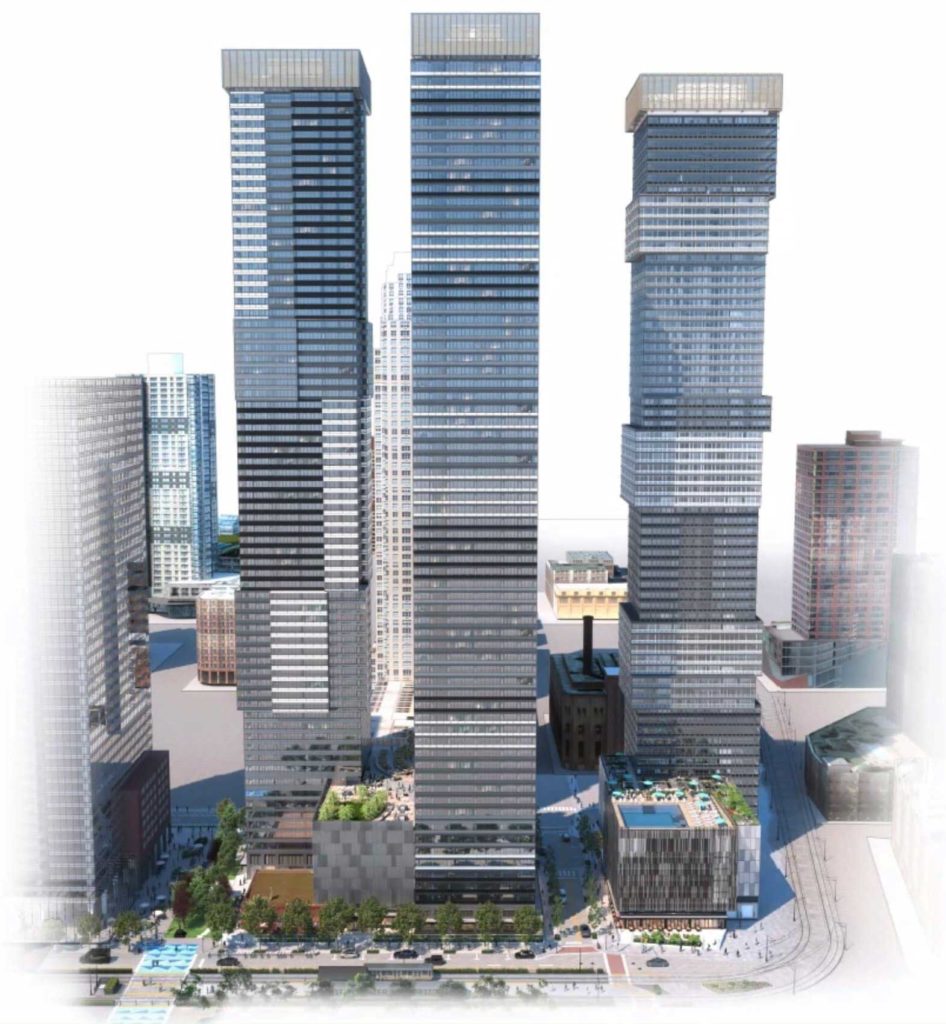
Rendering of the design for towers two and three of Urby (on the left and center). Image courtesy of HLW International.
Nonetheless, the second phase of Urby at 200 Greene Street is set to include a pair of 69-story towers that top out at 677 feet. Some changes were made to the design of the towers themselves in 2022, with the “Jenga-like” nature of the original Urby being scaled back a bit.
Designed by Toronto-based Concrete with HLW International as the architect of record, the northernmost tower of Urby’s second phase will be straightforward and lack any offset sections. The southernmost tower, on the other hand, will still have a similar feel to the initial Urby phase albeit less pronounced.
Image courtesy of HLW International.
The latest approved version reduces the total unit count for final two towers by about 100 to 1,510 units, with the developers reserving the right to designate up to 164 of the units for hotel use. No affordable housing is included in the plans, as none was required at the time of the development’s initial approval.
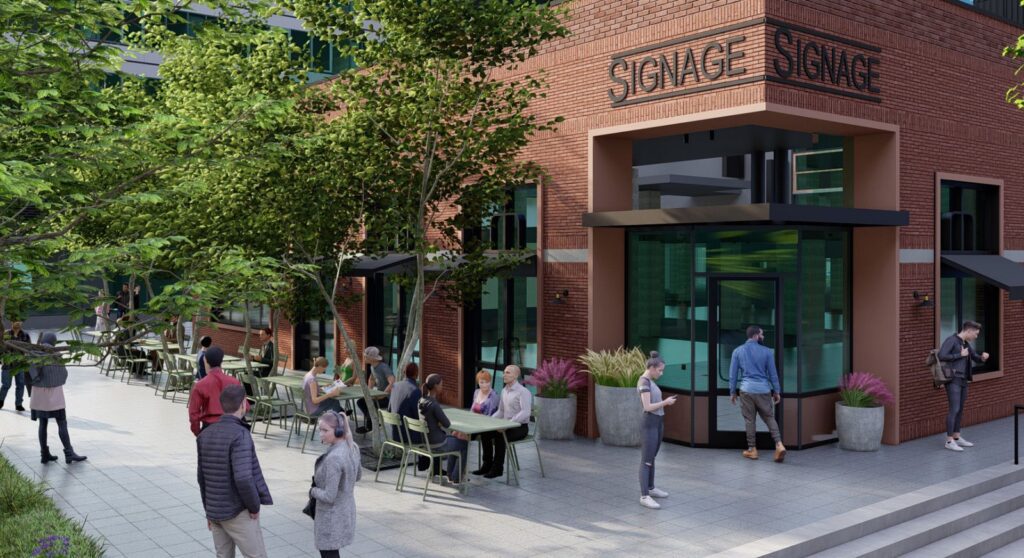
The development’s retail component. Image by HLW International via the application.
A combined 32,000 square feet of retail space will call the ground floor of the complex home, being split between four storefronts. The existing greenery between the Urby parking lot and Harborside 5 will also be spruced up under the plan, with a new pedestrian walkway and park space.
The future plaza that will be built as part of the development. Image by HLW International via the application.
Urby’s final portion is set to feature a 272-space parking garage base with a valet option plus a finished rooftop that connects the towers. Plans for the roof of the garage include an outdoor pool and landscaped garden hill, while other amenities at Urby’s second phase include a sprawling second-floor fitness center set to sport an indoor pool.
Attorneys for Ironstate and Roseland stated during a planning board meeting in 2022 that the base of the latest Urby complex would be built first, then to be followed by one of the towers. The second tower would then be built after the completion of the first, meaning the development still has two phases.
The green space included in Urby. Image by HLW International via the application.
The developers have not issued any statement thus far about a potential groundbreaking ceremony for Urby, but the closure of the parking lot is a telltale sign the project is coming soon.
This stretch of Jersey City ‘s waterfront is already busy and is likely to emerge as the next epicenter of development. Harborside 8 is currently under construction diagonally across from the Urby site, while the Port Authority is building a new substation to replace the aging Powerhouse building.
Related Companies has approvals in place for the 800-unit Harborside 4 just two blocks south of Urby’s last act. Jersey City’s first supertall is in the works for an empty lot two blocks west, while Jersey Digs recently unearthed images of another three-tower, 2,000-unit plan for a parking lot on Washington Street. 2026
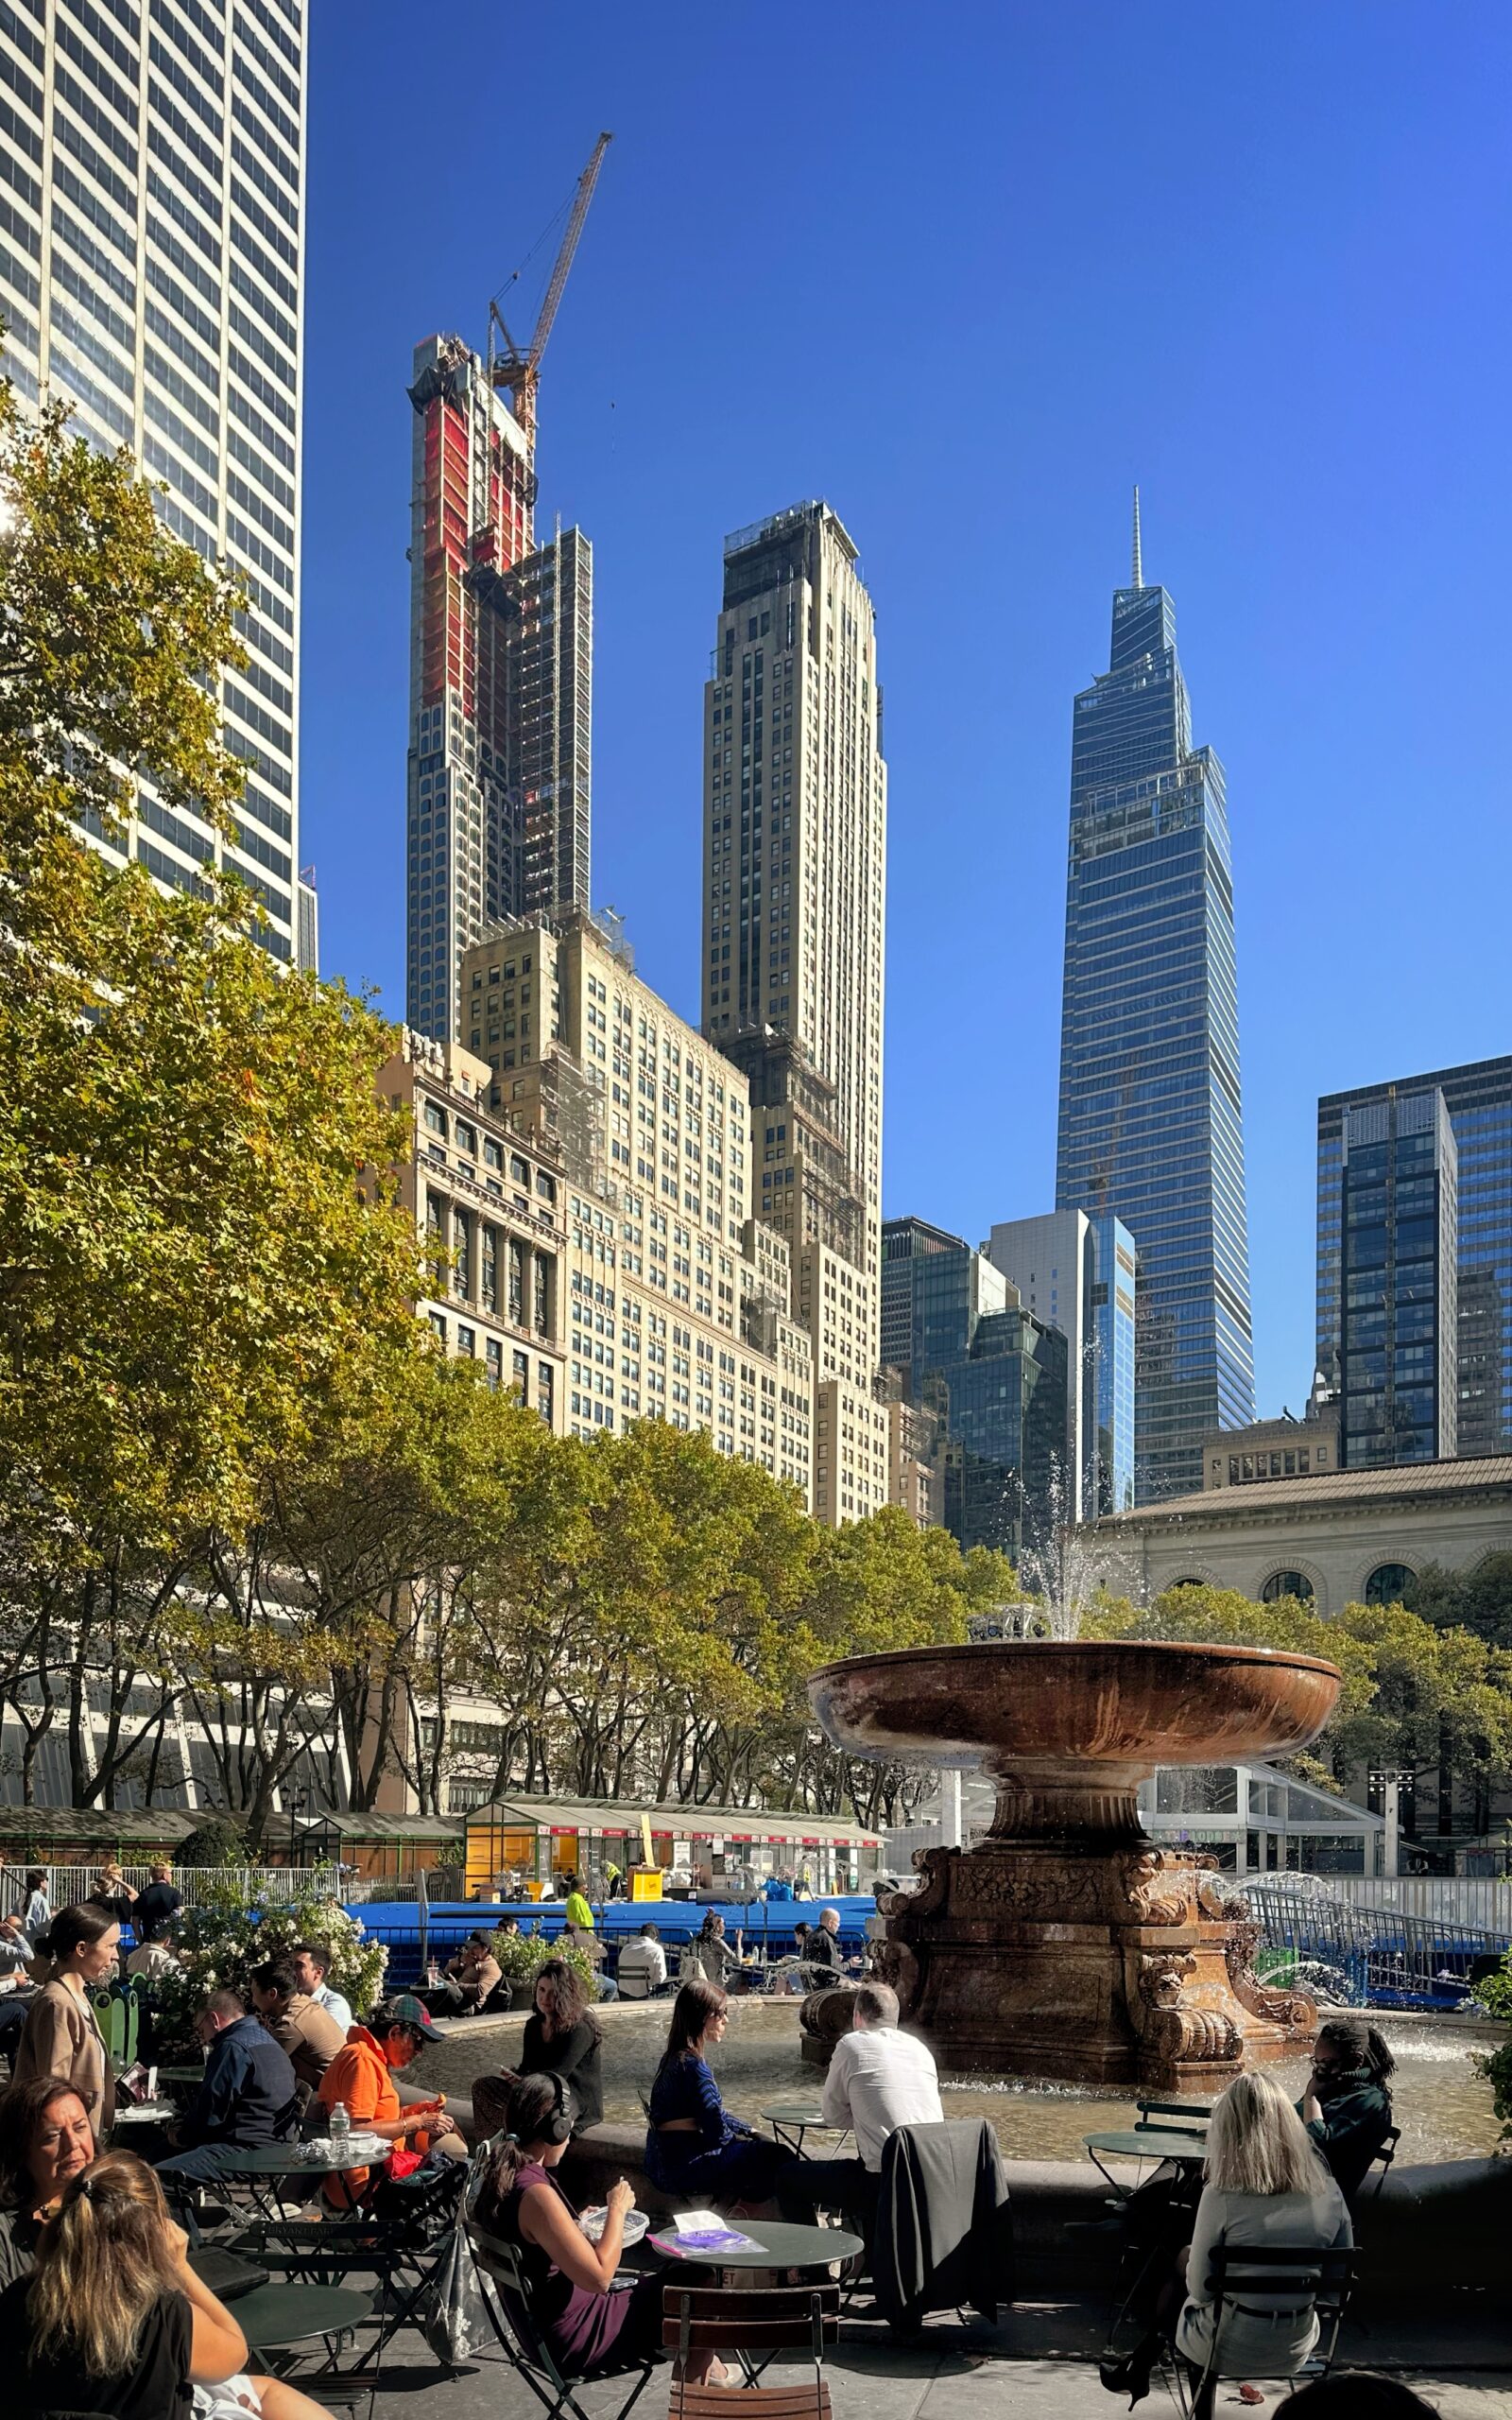
As temperatures begin to drop, New York City’s construction market shows no signs of cooling down. New York YIMBY’s construction report for the third quarter of 2024, based on permit filings submitted to the Department of Buildings during the three-month period from July through September, shows strong filing activity that indicates momentum is continuing from the preceding quarterly tallies. In the third quarter, New York’s developers filed permits for a total of 1,071 new buildings, measuring a combined 26.8 million square feet with 18,935 residential and hotel units. Below, we break the data down in a series of detailed analyses.
Photo by Michael Young
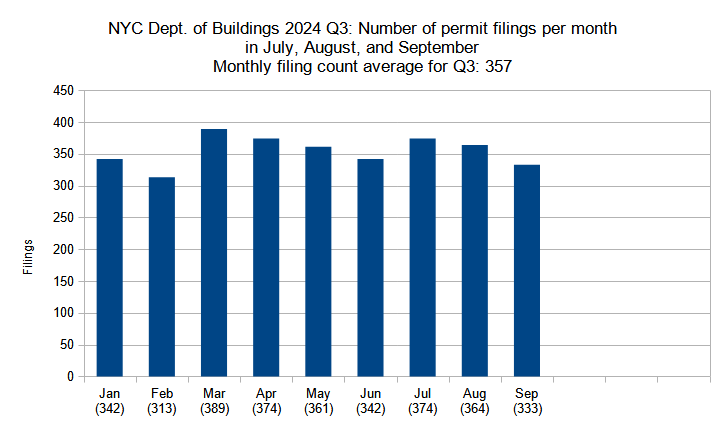
Number of permit filings per month
Number of new construction permits filed per month in New York City in Q1 through Q3 (January through September) 2024. Data source: the Department of Buildings. Data aggregation and graphics credit: Vitali Ogorodnikov
The third quarter of 2024 saw sustained strength in permit filing activity, with an average of 357 new building permits filed per month from July through September. The tally essentially matches that of the second quarter, dropping by just two permits from the Q2 average of 359. As such, Q3 2024 features the third-highest average since YIMBY began keeping count at the start of the decade, with the four past consecutive averages all comprising the top four places.
Photo by Michael Young
Number of permit filings by borough
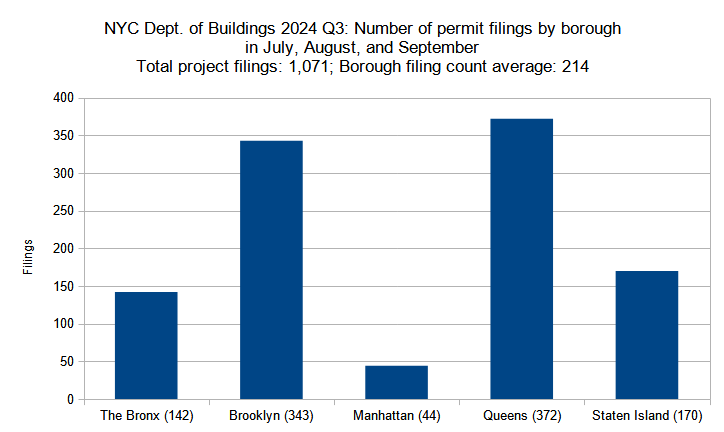
Number of new construction permits filed per borough in New York City in Q3 (July through September) 2024. Data source: the Department of Buildings. Data aggregation and graphics credit: Vitali Ogorodnikov
Below is the breakdown of borough statistic changes between the year’s second and third quarters:
The Bronx: 28-percent increase (111 to 142 permits)
In the third quarter, the greatest gains were observed in The Bronx and Manhattan, with 28- and 26-percent increases in total filing numbers, respectively. The tally for Staten Island remained virtually the same as in the preceding quarter. And while Queens and Brooklyn both registered single-digit percentage drops in filing counts (9 and 3 percent, respectively), the two boroughs still maintain a significant lead, with each accounting for around as many filings as The Bronx, Manhattan, and Staten Island combined.
Photo by Michael Young
Permits listed by unit count per filing
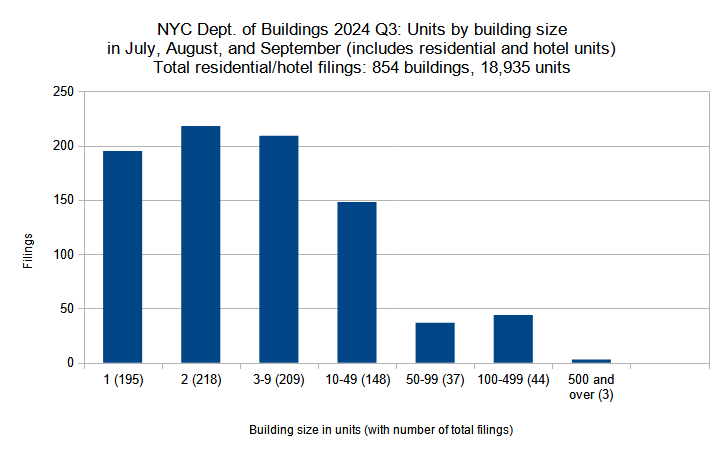
New residential and hotel construction permits filed in New York City in Q3 (July through September) 2024 grouped by unit count per filling. Data source: the Department of Buildings. Data aggregation and graphics credit: Vitali Ogorodnikov
Below, the filing size categories are compared between the two quarters individually:
Single-family: 14-percent decrease (227 to 195 filings)
Two-family: 17-percent decrease (263 to 218)
Three to nine units: 14-percent increase (184 to 209)
Ten to 49 units: 18-percent increase (125 to 148)
50 to 99 units: 37 units in both Q2 and Q3 each
100 to 499 units: 10-percent increase (40 to 44)
500 and over: none in Q2 to 3 in Q3
A total of 18,935 residential and hotel units were filed for in New York City in the third quarter of 2024, a dramatic 28-percent increase from the 14,795 units filed for in Q2. The increase is attributed to a growth in filings for larger multi-unit dwellings: while the single- and two-family categories saw double-digit percentage drops between the two quarters, every category with three or more residences per filing registered double-digit percentage increases. Notably, while no building with over 500 units was filed for in Q2, filings for three such developments are on the record books for Q3.
Photo by Michael Young
Residential and hotel units filed per borough
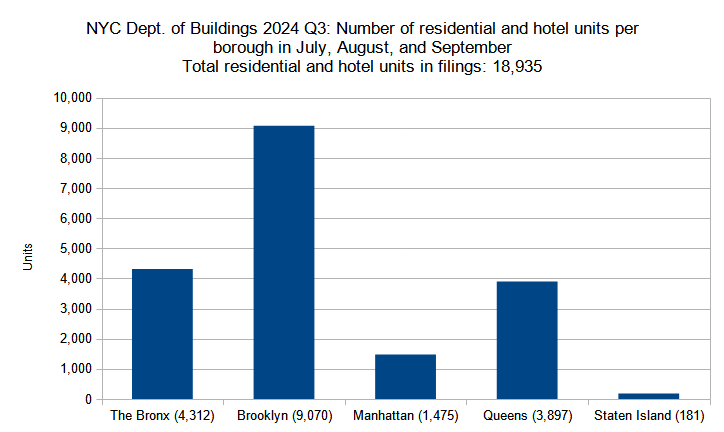
Number of residential and hotel units in new construction permits filed per borough in New York City in Q3 (July through September) 2024. Data source: the Department of Buildings. Data aggregation and graphics credit: Vitali Ogorodnikov
Below is a by-borough comparison between the two quarters:
The Bronx: 38-percent increase (3,116 to 4,312 residential and hotel units)
Brooklyn: 45-percent increase (6,247 to 9,070)
Manhattan: 34-percent decrease (2,221 to 1,475)
Queens: 32-percent increase (2,950 to 3,897)
Staten Island: 47-percent increase (123 to 181)
Four of the five boroughs saw substantial double-digit percentage increases of residential and hotel unit filings during the third quarter of 2024. With over 9,000 unit filings, Brooklyn remains the undisputed leader. Though Staten Island’s 181 new filed-for units is low overall figure for a borough with half a million residents, it shows the greatest quarterly improvement with 47-percent growth. Manhattan makes for a notable exception to the trend, dropping by 746 units, or 34 percent, between the two quarters.
Photo by Michael Young
Permits listed by average unit count per filing
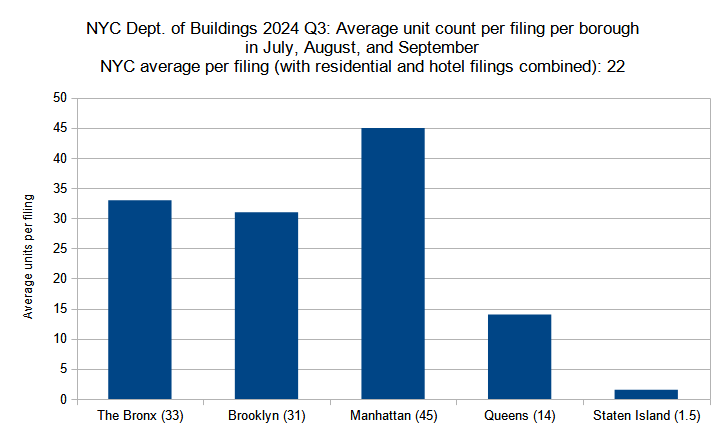
Average unit count (residential and hotel) per new construction permit per borough filed in New York City in Q3 (July through September) 2024. Data source: the Department of Buildings. Data aggregation and graphics credit: Vitali Ogorodnikov
Below is a by-borough comparison between the two quarters:
The Bronx: 6-percent increase (31 to 33 residential and hotel units)
Brooklyn: 55-percent increase (20 to 31)
Manhattan: 45-percent decrease (82 to 45)
Queens: 56-percent increase (9 to 14)
Staten Island: 29-percent decrease (2.1 to 1.5)
In the third quarter of 2024, residential and hotel unit count averages per filing per borough generally echo the trends in overall unit count growth per borough. The average unit count per filing grew significantly in The Bronx, Brooklyn, and Queens. The count dropped by more than a quarter in Staten Island, slipping from 2.1 to 1.5 average units, though the borough’s construction market remains well within the single- to two-family residential category. And while Manhattan maintains the overall lead, the borough’s average unit count per filing decreased by nearly half.
Photo by Michael Young
Permit filings by floor count category
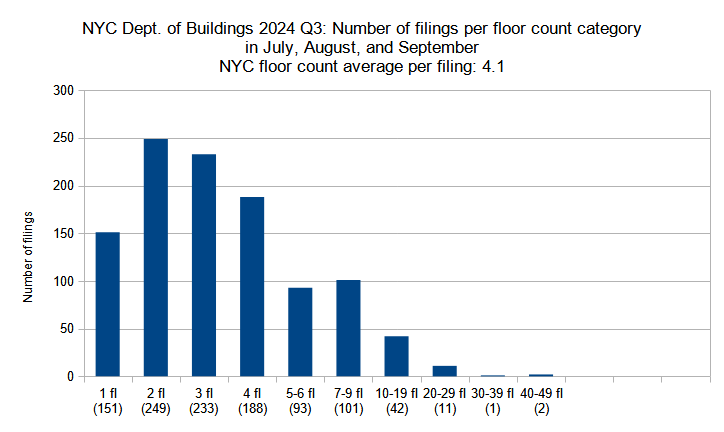
New construction permits filed in New York City in Q3 (July through September) 2024 grouped by floor count. Data source: the Department of Buildings. Data aggregation and graphics credit: Vitali Ogorodnikov
Below is a comparison per floor-count category between the two quarters:
Single-story: 6-percent increase (142 to 151 permits)
Two-story: 10-percent decrease (278 to 249)
Three-story: 8-percent decrease (253 to 233)
Four-story: 6-percent increase (178 to 188)
Five to six floors: 93 in both Q2 and Q3 each
Seven to nine floors: 3-percent decrease (104 to 101)
Ten to 19 floors: 100-percent increase (21 to 42)
20 to 29 floors: 120-percent increase (5 to 11)
30 to 39 floors: 67-percent decrease (3 to 1)
40 to 49 floors: none in Q2, two in Q3
In the third quarter of 2024, the average filing saw a notable increase in floor count, growing from 3.7 in Q2 to 4.1 in Q3. Two of the three categories of filings with three stories and below saw drops in filing totals; on the other hand, four out of seven of the categories with four and more stories saw filing number increases, with the ten-19- and 20-29-story groups doubling their totals. While no filing in Q2 reached the 40-story mark, three filings matched or surpassed the figure in Q3.
Below are the top five permit filings with the highest floor counts in Q3 2024, in order:
51 Willoughby Street in Brooklyn (43 floors)
42-19 24th Street in Queens (40 floors)
188 Duffield Street in Brooklyn (30 floors)
574 5th Avenue in Manhattan (29 floors)
219 East 42nd Street in Manhattan (29 floors)
Photo by Michael Young
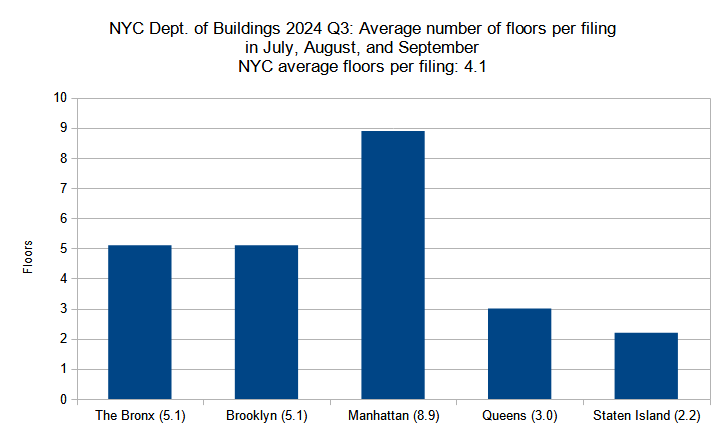
Average number of floors per filing per borough
Average number of floors per new construction permit per borough filed in New York City in Q3 (July through September) 2024. Data source: the Department of Buildings. Data aggregation and graphics credit: Vitali Ogorodnikov
Below is the by-borough comparison between the two quarters:
The Bronx: 5.1 floors in both Q2 and Q3 each
Brooklyn: 13-percent increase (4.5 to 5.1 floors)
Manhattan: 9-percent decrease (9.8 to 8.9)
Queens: 11-percent increase (2.7 to 3)
Staten Island: 4-percent decrease (2.3 to 2.2)
While the average floor count per filing increased, the overall trend line has remained stable. Manhattan, known for its vertiginous skyline, maintains a solid lead among the boroughs, although its floor count average per filing dipped from 9.8 to 8.9. Brooklyn caught up to The Bronx, matching its 5.1-story average. Queens and Staten Island trail with averages of three and 2.2 stories per filing, respectively.
Photo by Michael Young
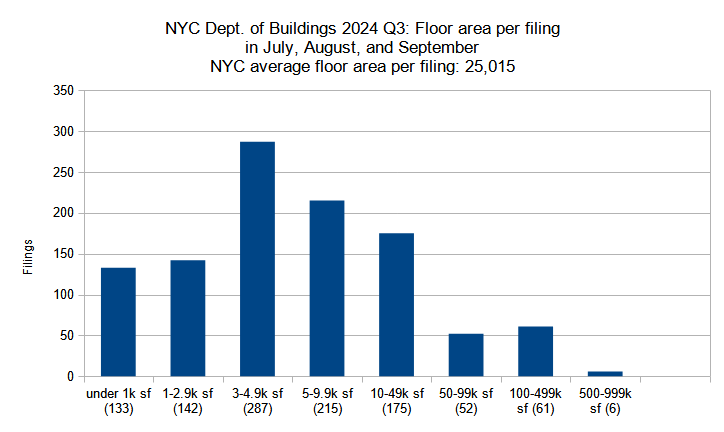
Permits listed by floor area per filing
New construction permits filed in New York City in Q3 (July through September) 2024 grouped by total floor area. Data source: the Department of Buildings. Data aggregation and graphics credit: Vitali Ogorodnikov
Below is a breakdown by floor area category:
Under 1,000 square feet: 7-percent increase (124 to 133 permits)
1,000 to 2,999 SF: 19-percent decrease (175 to 142)
3,000 to 4,999 SF: 3-percent decrease (297 to 287)
5,000 to 9,999 SF: under 1-percent decrease (216 to 215)
10,000 to 49,999 SF: 9-percent increase (160 to 175)
50,000 to 99,999 SF: 5-percent decrease (55 to 52)
100,000 to 499,999 SF: 27-percent increase (48 to 61)
500,000 to 999,999 SF: 500-percent increase (1 to 6)
The third quarter saw a dramatic 25-percent growth in the overall filed-for floor area, surging from 21.5 million square feet in Q2 to 26.8 MSF in Q3. The growth may be largely attributed to increases among the larger building categories, particularly for proposed structures with 10,000 or more square feet (roughly equivalent to a ten- or 15-unit apartment building). Notably, while the second quarter registered just one filing in the half-million-square-foot-plus category, the third quarter saw six such filings.
Photo by Michael Young
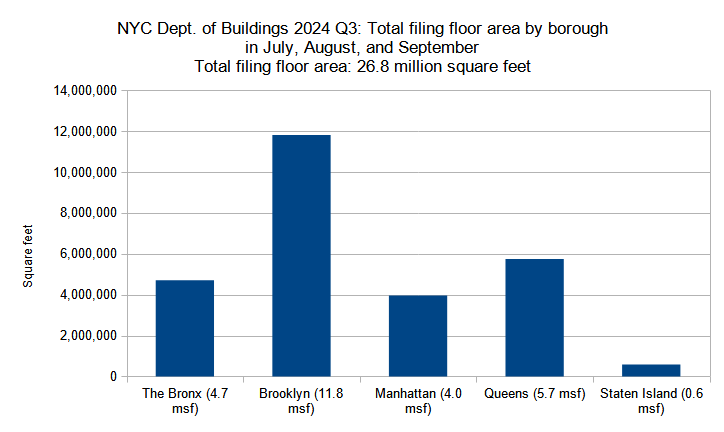
Total floor area filed by borough
Combined floor area of new construction permits filed per borough in New York City in Q3 (July through September) 2024. Data source: the Department of Buildings. Data aggregation and graphics credit: Vitali Ogorodnikov
Below are the square footage totals per borough compared between the two quarters:
The Bronx: 56-percent increase (3 to 4.7 million square feet)
Brooklyn: 18-percent increase (10 to 11.8 MSF)
Manhattan: 46-percent increase (2.7 to 4 MSF)
Queens: 12-percent increase (5.1 to 5.7 MSF)
Staten Island: 10-percent decrease (0.64 to 0.58 MSF)
The third quarter of 2024 registered an increase in filed-for floor area from 21.5 million square feet in Q2 to 26.8 MSF in Q3. This growth is rather relatively evenly distributed across the city, with almost every borough registering double-digit percentage growth. Even Staten Island, the only part of the city to show a percentage decrease, remains at an overall stable total of approximately half a million square feet of new floor space filed for both in Q2 and Q3.
Photo by Michael Young
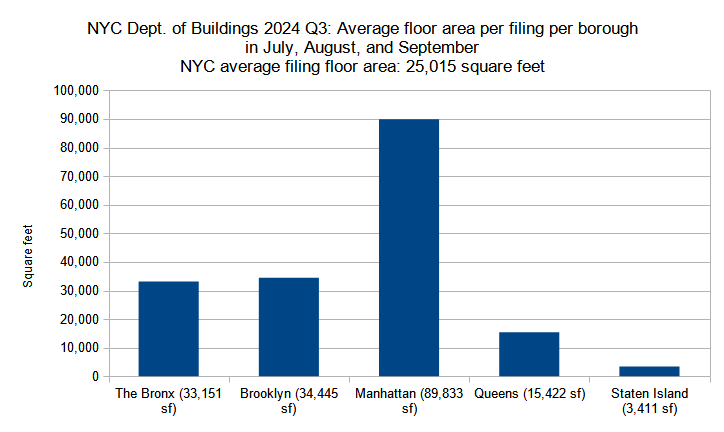
Average floor area per permit filing by borough
Average floor area per new construction permit per borough filed in New York City in Q3 (July through September) 2024. Data source: the Department of Buildings. Data aggregation and graphics credit: Vitali Ogorodnikov
Below is the quarterly comparison for the boroughs:
The Bronx: 22-percent increase (27,248 to 33,151 square feet)
Brooklyn: 22-percent increase (28,178 to 34,445 SF)
Manhattan: 16-percent increase (77,130 to 89,833 SF)
Queens: 23-percent increase (12,543 to 15,422 SF)
Staten Island: 10-percent decrease (3,797 to 3,411 SF)
The floor area of the average permit filing increased significantly between the second and third quarters of 2024, growing from 19,938 to 25,015 square feet. Just as four out of five boroughs saw major increases in total filed-for floor space, they also observed concurrent double-digit percentage increases in average floor area per filing. Though Staten Island, still predominantly comprised of single- and two-family houses, saw a 10-percent drop in its filing size average, the overall decrease amounts to just 386 square feet per average filing, dropping from 3,797 in Q2 to 3,411 in Q3.
Plus, a master plan to reconstruct Gaza’s housing and infrastructure, Cantor Group saga reaches Manhattan and more national real estate news this week
Andrew Cuomo, Zohran Mamdani, Emilio Gonzalez, Eileen Higgins and Joe Carollo (Getty)
Oct 26, 2025, 9:00 AM EDT
By Mike Romano
Save article
With Election Day just over a week away, real estate interests are closely watching mayoral races and ballot measures that could shape local markets for years to come.
From New York to Miami, developers, brokers and landlords are spreading their bets across candidates who promise growth, clarity and, ideally, predictability.
In New York City, what began as a crowded field has narrowed into a three-way fight where housing policy has become a defining issue. Zohran Mamdani, a Democratic Socialist who wants to freeze stabilized rents for four years, has rattled landlords and condo owners. Former Gov. Andrew Cuomo, running as an independent, is calling for tweaks to Local Law 97 and positioning himself as the pragmatist, and the clear favorite of the real estate world.
According to The Real Deal’s analysis, the industry has pumped about $12.4 million into the race, with roughly $11 million flowing through super PACs. Cuomo’s Fix the City PAC has drawn the lion’s share of that support (about $5.2 million) as major donors coalesce around a familiar ally. When Mayor Eric Adams exited the race last month, industry money rushed back to Cuomo, to the tune of $41,000 in just two days.
Still, Mamdani isn’t completely iced out. Affordable and nonprofit developers have quietly contributed, signaling they’re willing to work with him if he wins. Republican nominee Curtis Sliwa has pitched office-to-residential conversions as his main affordability plan, but with limited traction in the polls, most of the industry’s focus remains on the Cuomo–Mamdani showdown.
In Miami, the mayor’s race is a full-blown free-for-all, with 13 candidates vying to replace Francis Suarez. Top contenders, including Joe Carollo, Alex Diaz de la Portilla, Eileen Higgins and Xavier Suarez, are all drawing checks from the city’s development elite. Firms like Terra, Related Group and 13th Floor Investments are hedging their bets, donating to multiple campaigns at once. With Miami’s market under strain from high costs and political dysfunction, the city’s biggest players are seeking stability more than ideology.
In New Jersey, the race to replace Gov. Phil Murphy has the industry leaning red. Republican Jack Ciattarelli has raised about $1.3 million in real estate donations, which more than doubled Democrat Mikie Sherrill’s haul. The Adjmi, Chera and Cayre families are among Ciattarelli’s top backers, while the Dursts and Tisches are standing behind Sherrill. Real estate issues have been central in the election, as New Jersey is one of the most expensive states for housing and the most densely populated state in the country.
There aren’t any major mayoral races in Texas this cycle, but voters will weigh in on several real estate-related ballot measures. The biggest is Project Marvel, a $4 billion mixed-use development anchored by a new Spurs arena in San Antonio. Two local propositions would direct hotel and venue taxes toward the project, though polling shows mixed support and Mayor Gina Ortiz has questioned the team’s contribution. Statewide, measures include property tax relief for homeowners and seniors, a ban on any future inheritance tax and a proposal to protect “Y’all Street” by prohibiting taxes on financial transactions.
Out west, the 2026 California governor’s race is already a quiet proving ground for real estate influence. Former L.A. Mayor Antonio Villaraigosa leads the fundraising pack, drawing support from Related California’s Bill Witte, developer Joseph Moinian and broker Kurt Rappaport, many of whom applaud his skepticism of L.A.’s property transfer tax, Measure ULA.
There was plenty of other real estate news this week. Jared Kushner and Steve Witkoff pitched a $50B Gaza reconstruction, a Chicago investor turned on a longtime ally and a California firm related to Zions Bancorp’s stock tumble has ties to NYC real estate.
By: Michael Yound and Matt Pruznick 8:00 am on October 16, 2025
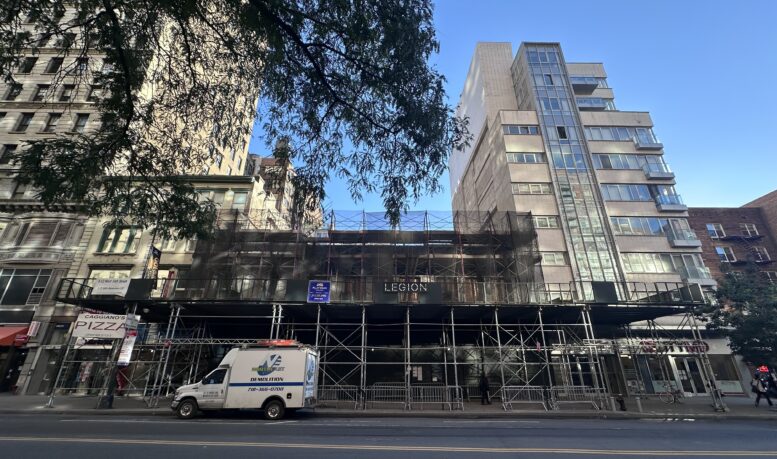
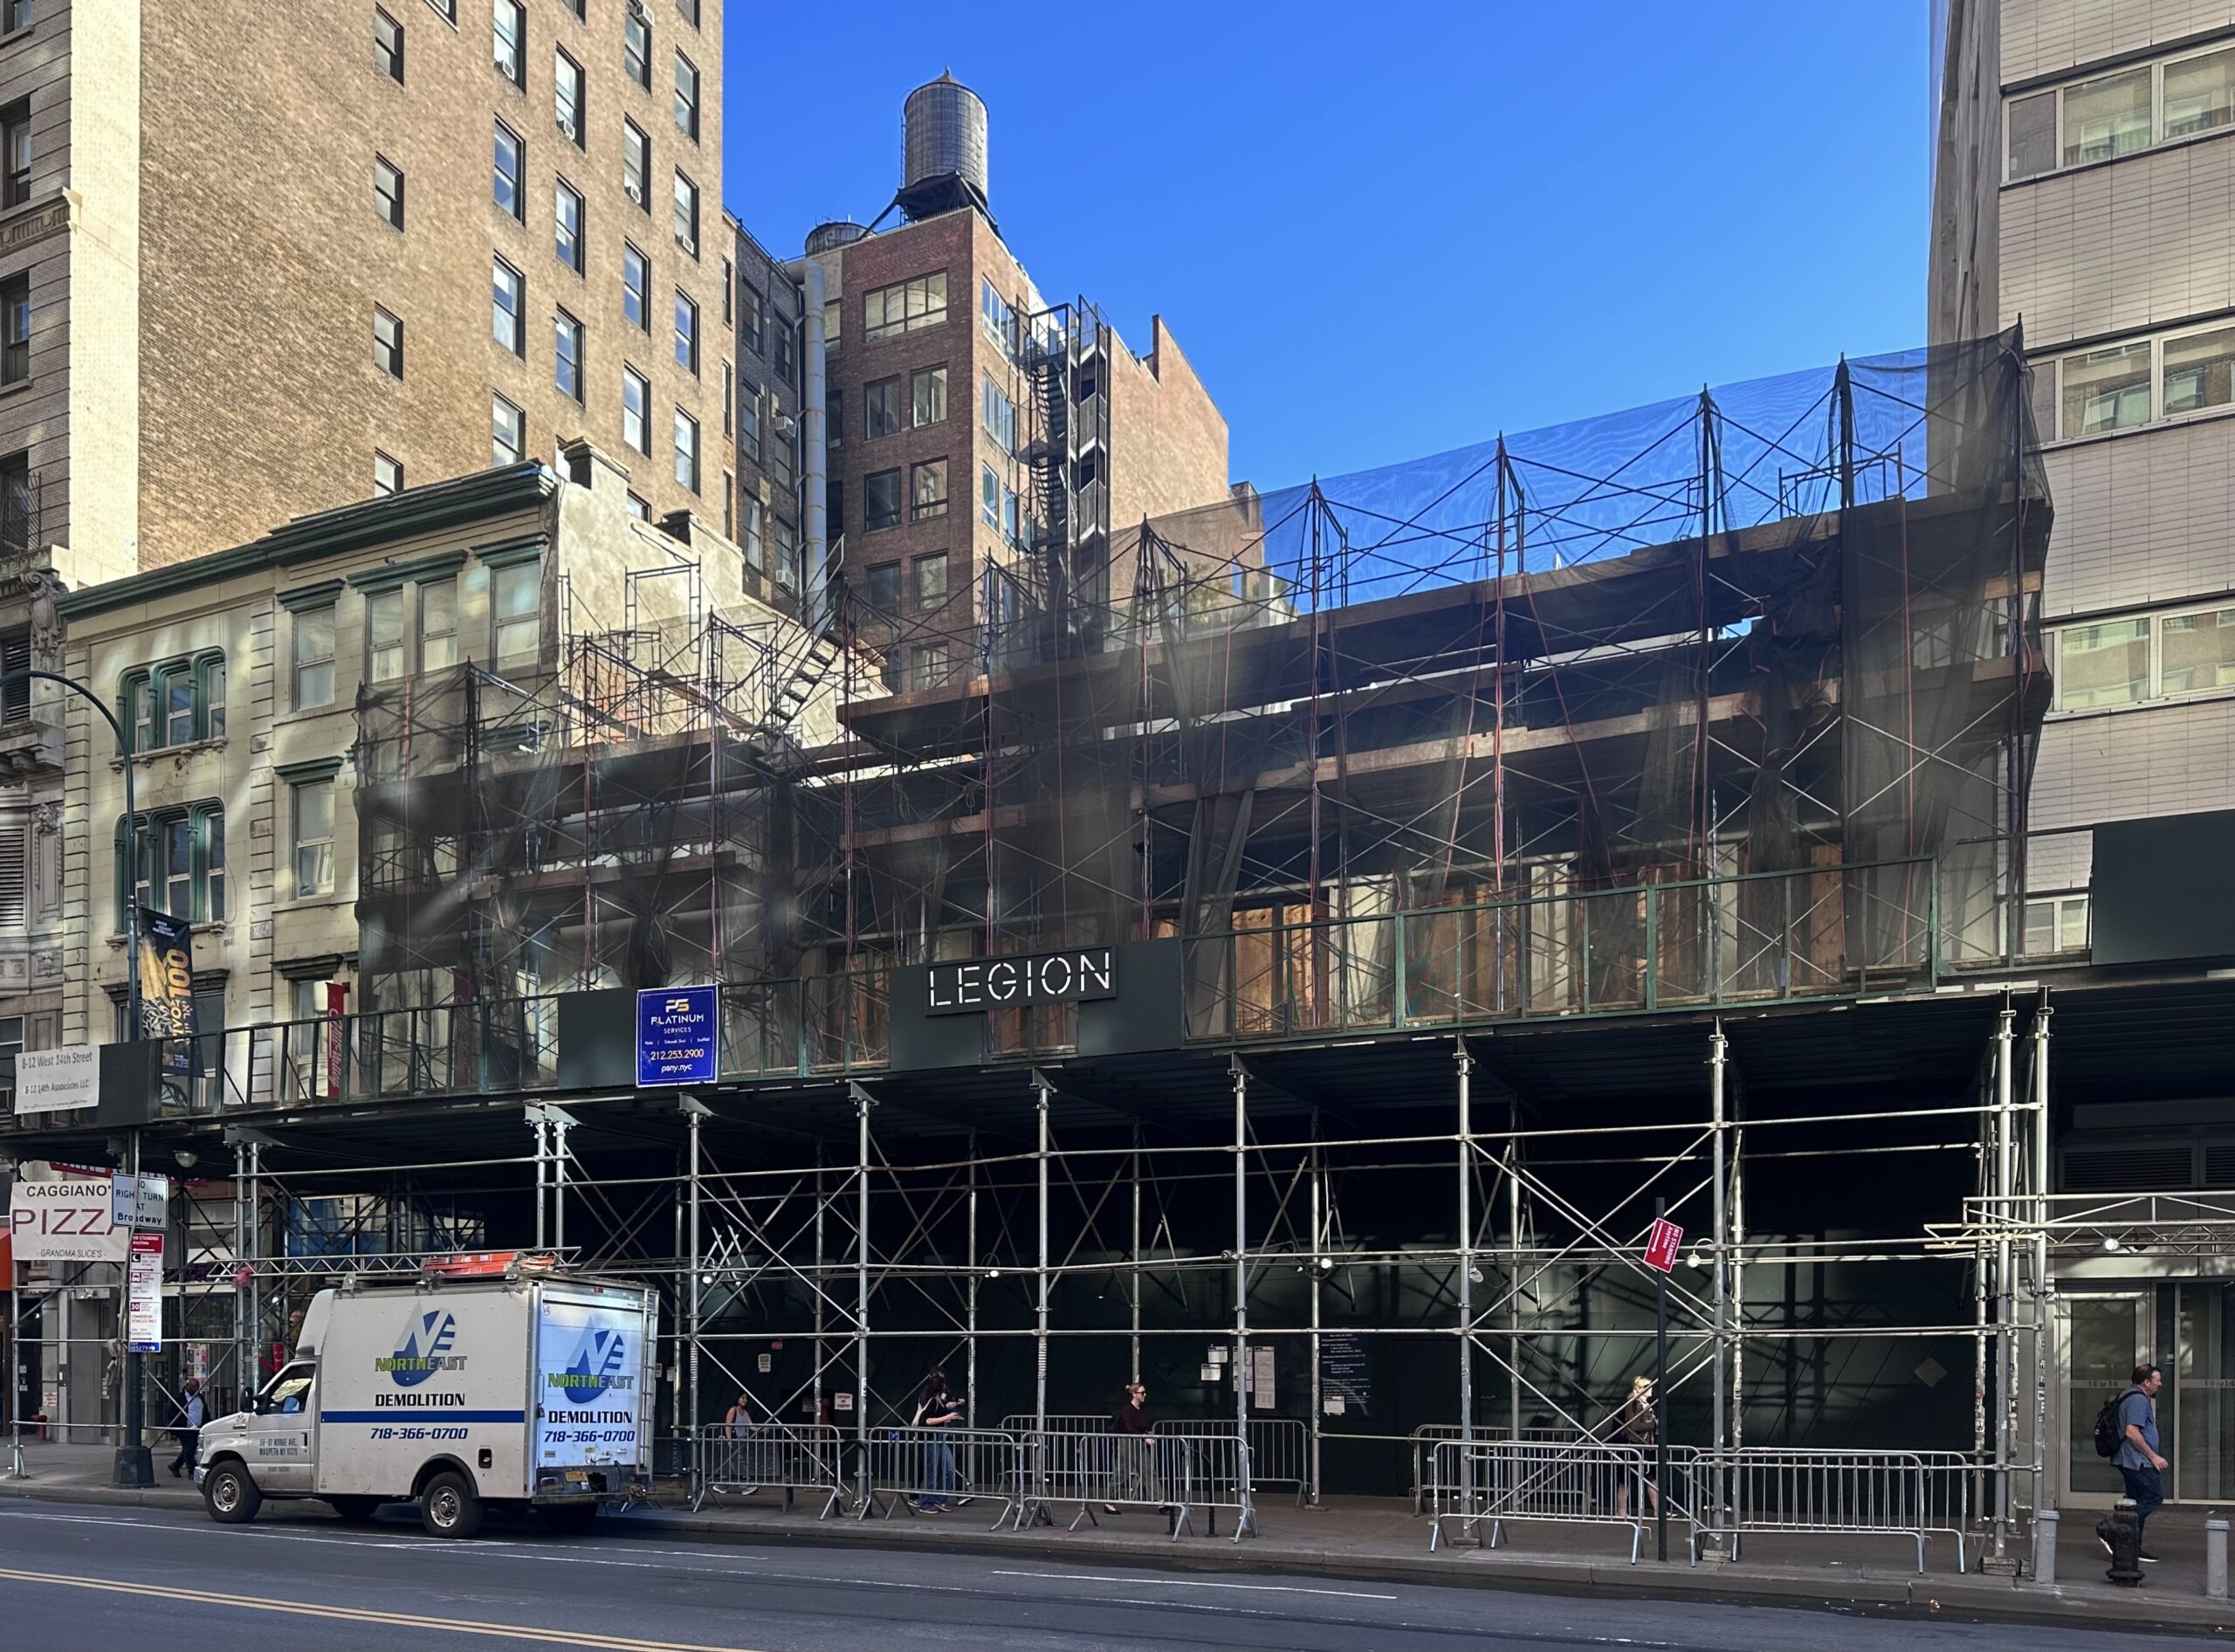
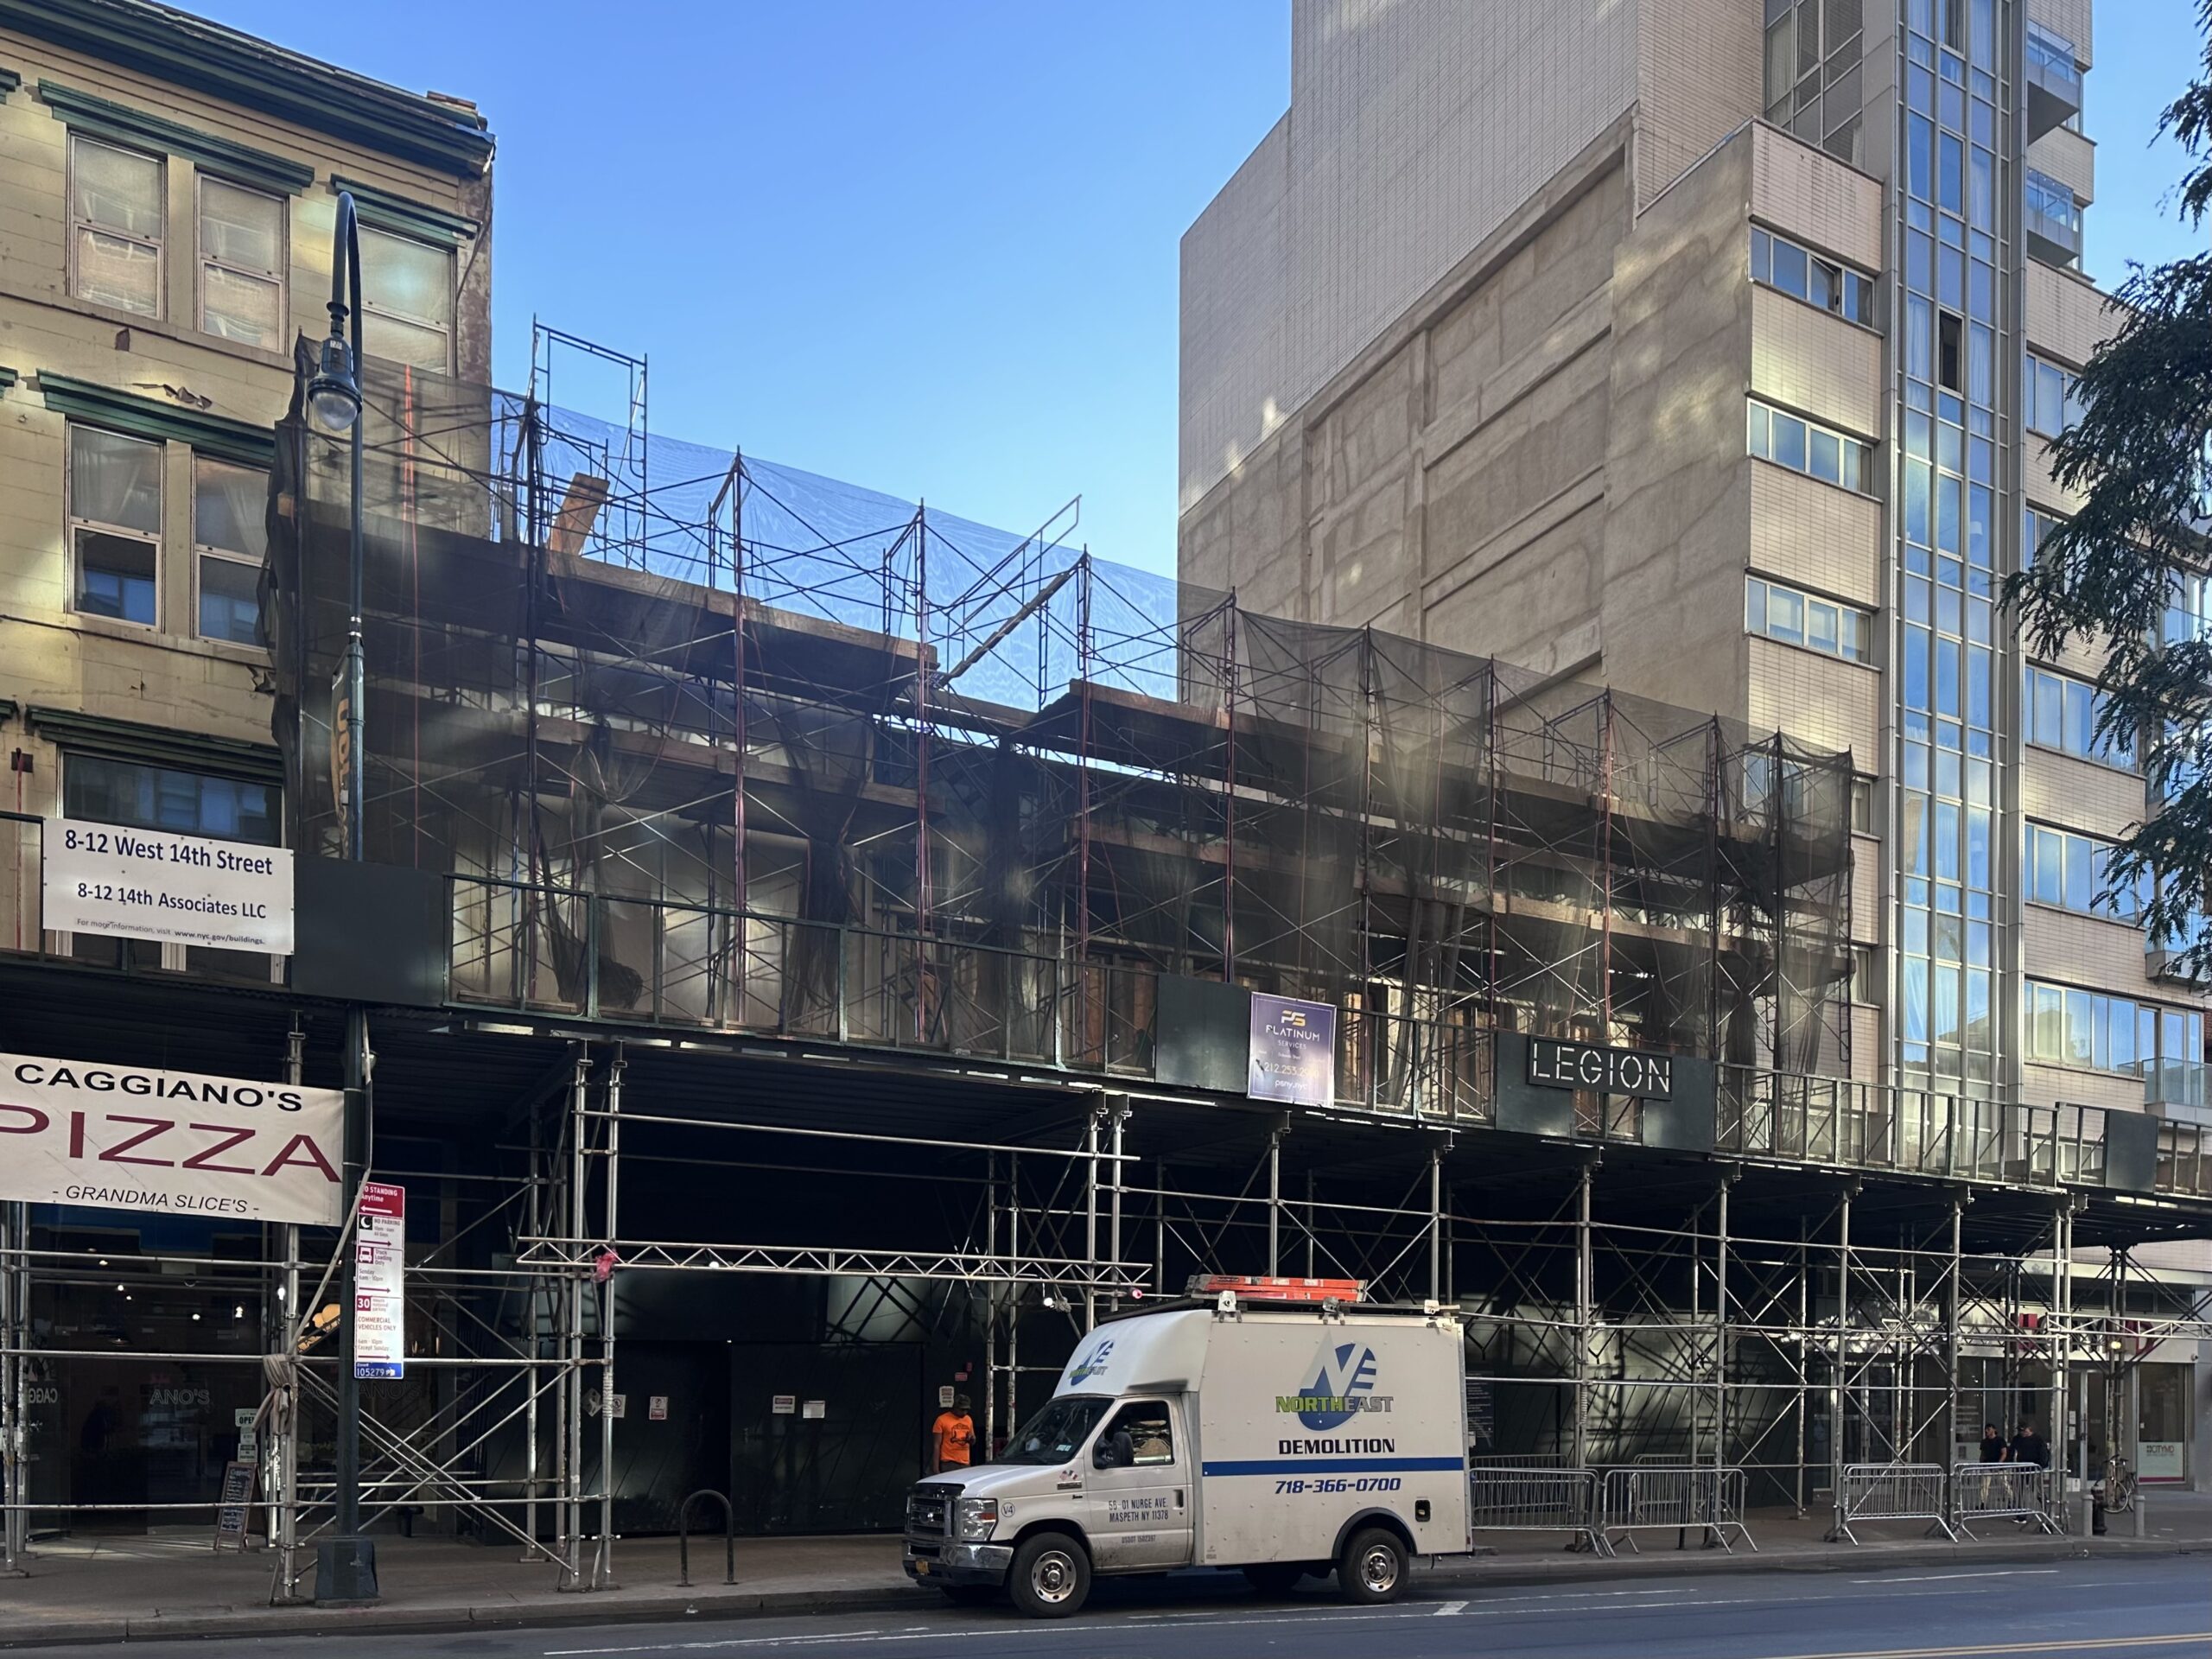
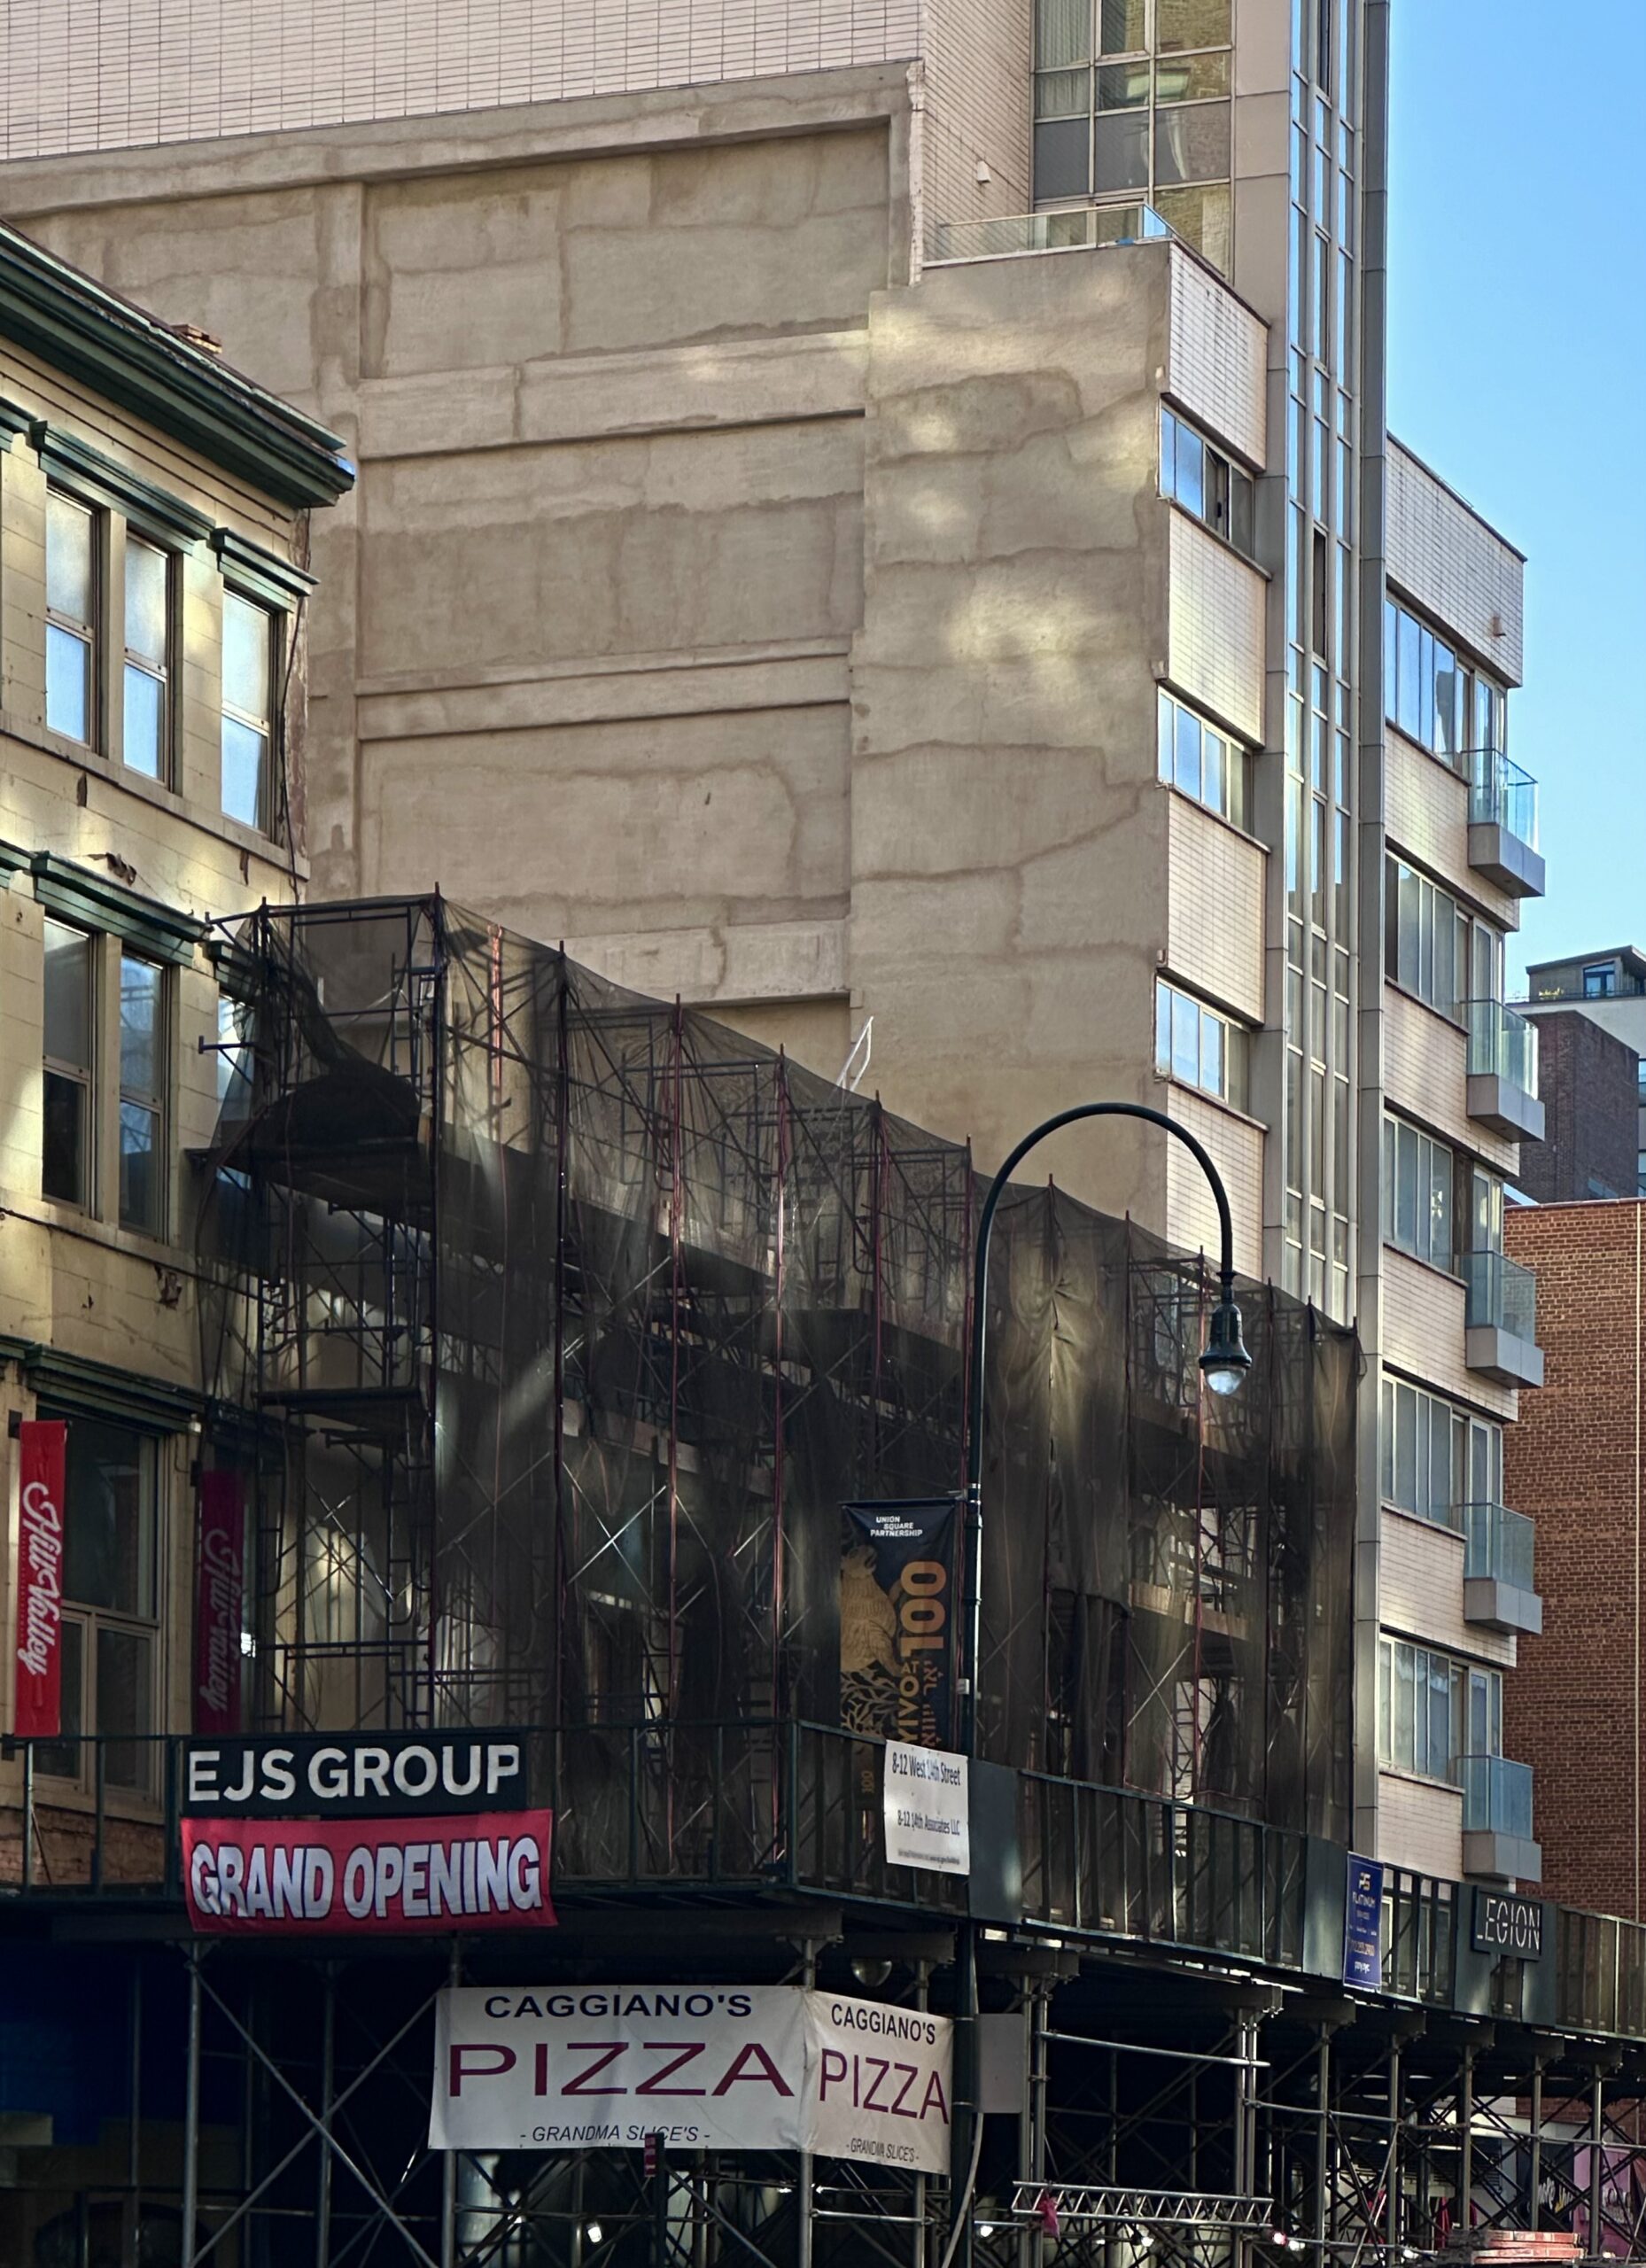
Demolition is finishing up at 5 West 13th Street, the site of a 30-story residential skyscraper in Greenwich Village, Manhattan. Designed by Kohn Pedersen Fox and developed by Legion Investment Group and EJS Group, the 538-foot-tall structure will span 111,022 square feet and yield 36 condominium units with an average scope of 3,020 square feet. The project will also include 2,300 square feet of ground-floor retail space with two storefronts. The through-lot property is alternately addressed as 8–12 West 14th Street and located between West 13th and West 14th Streets near Fifth Avenue and Union Square.
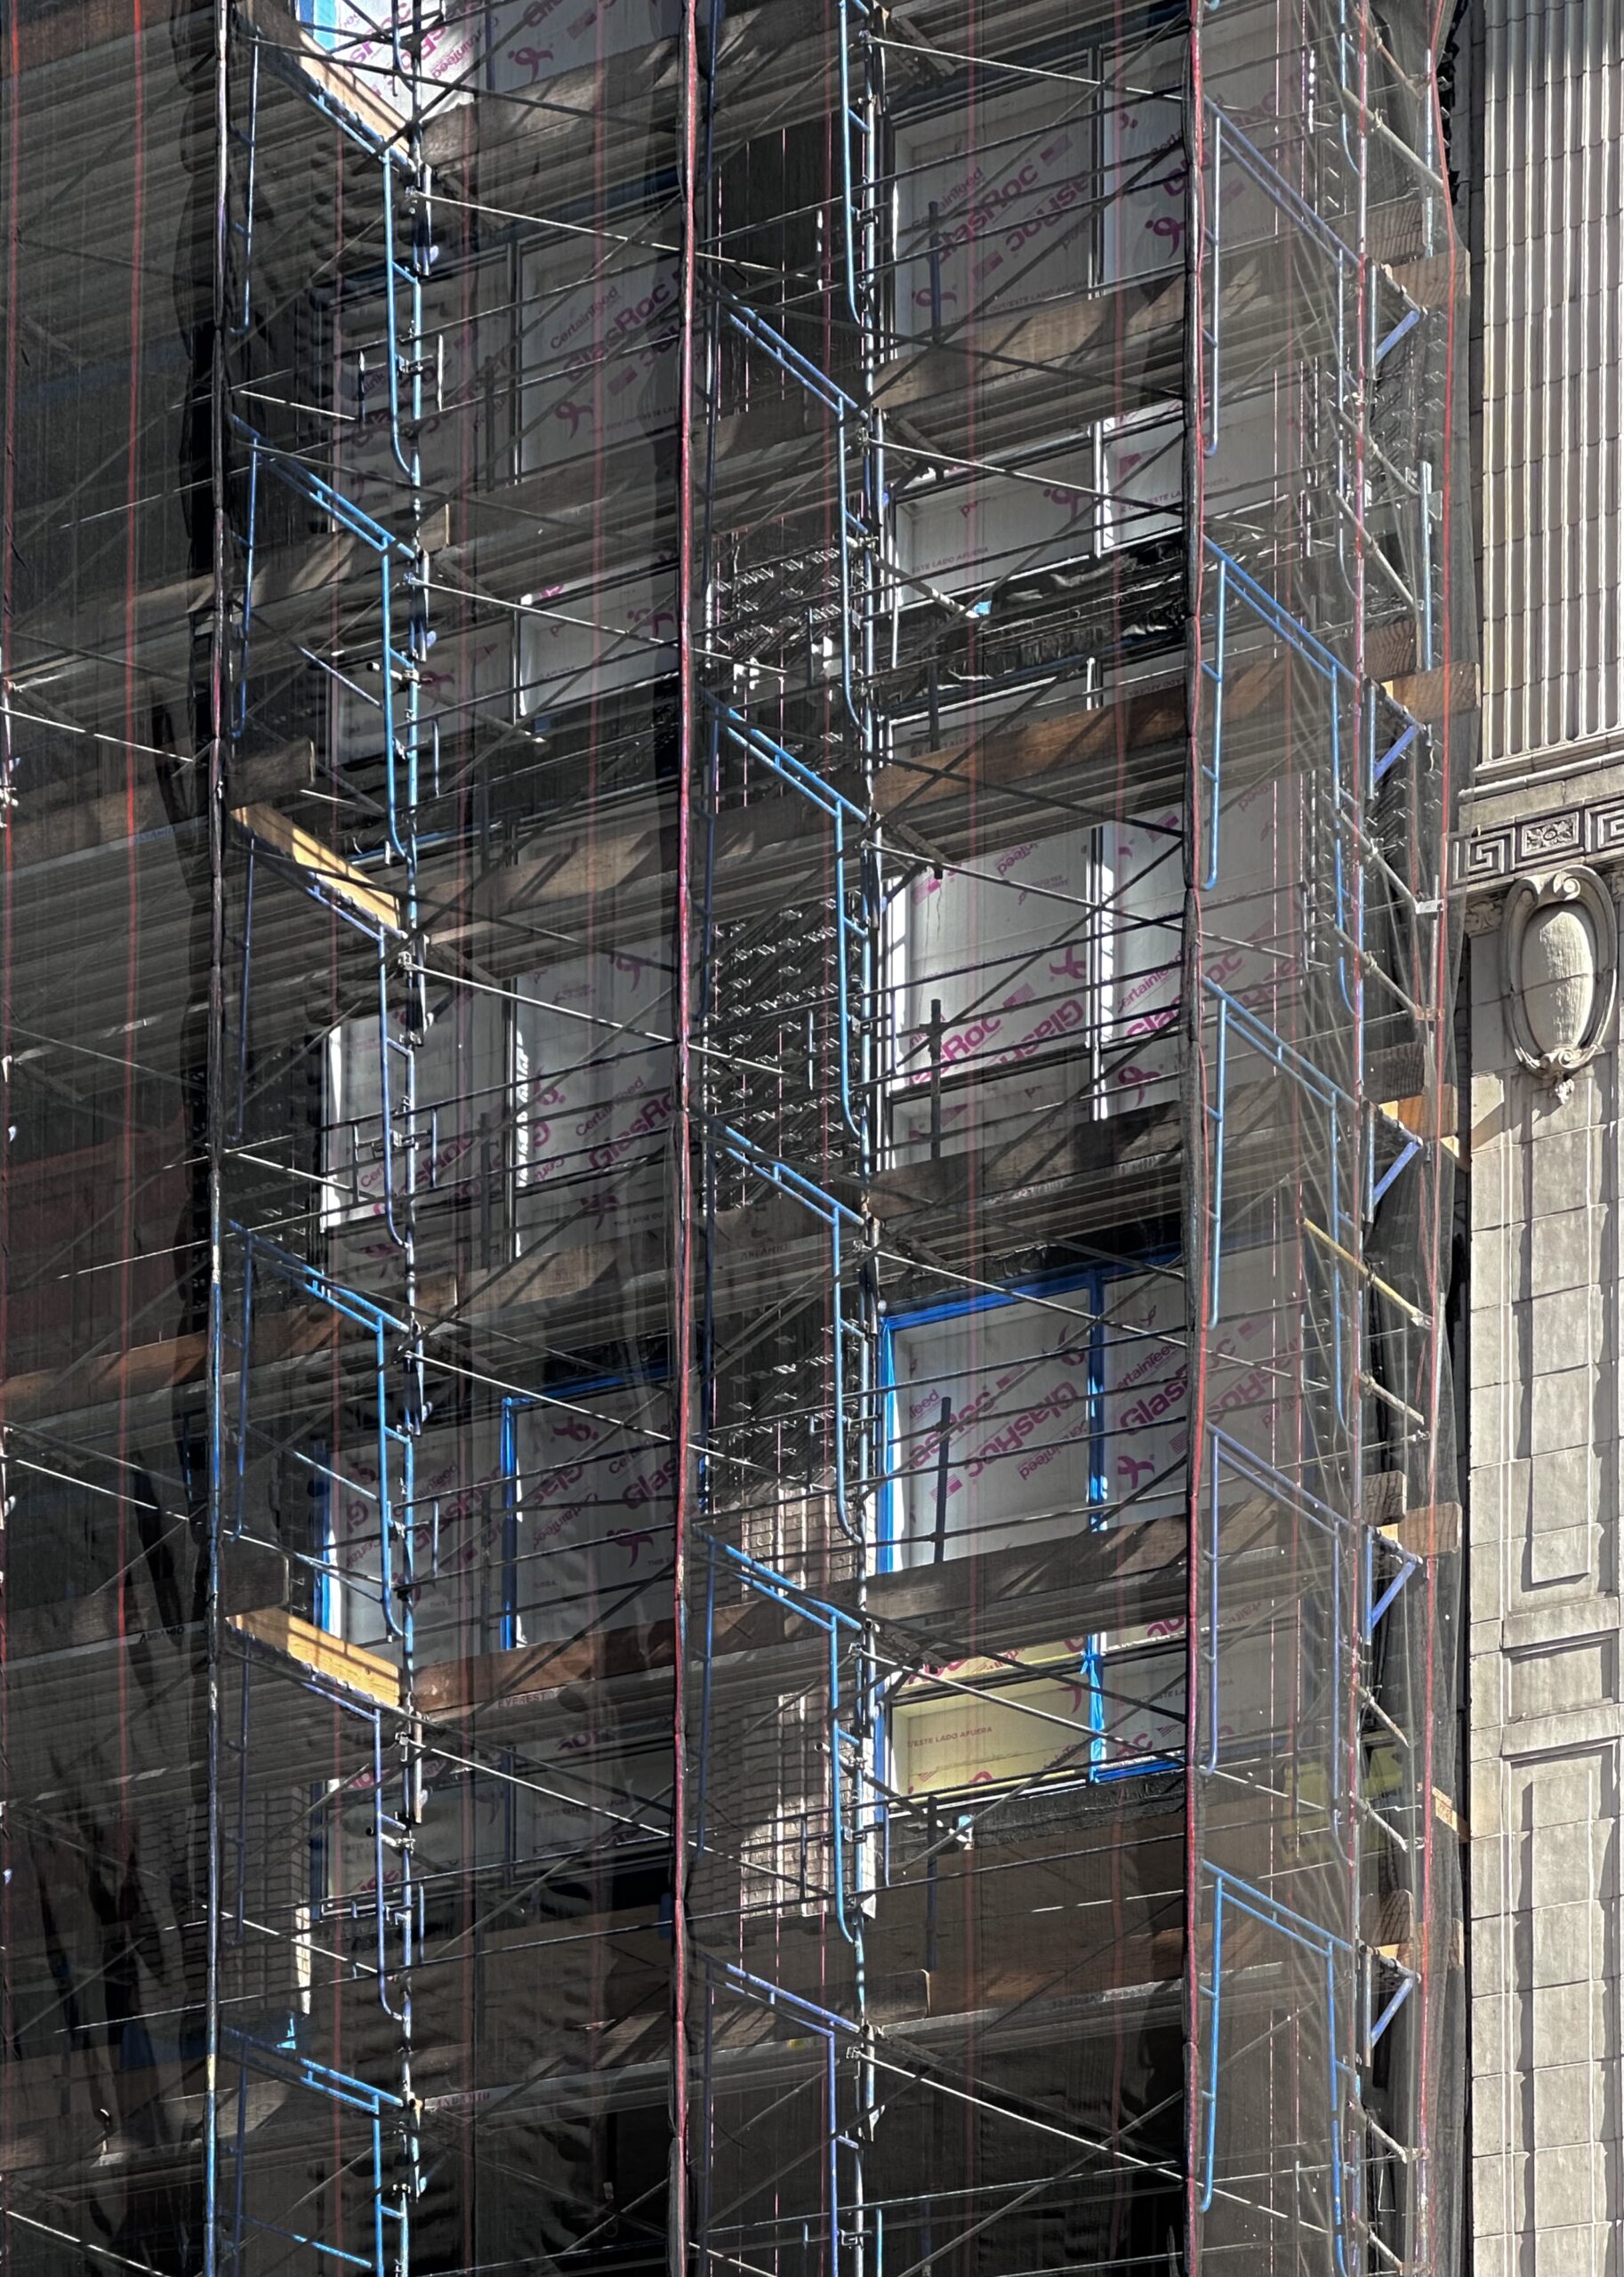
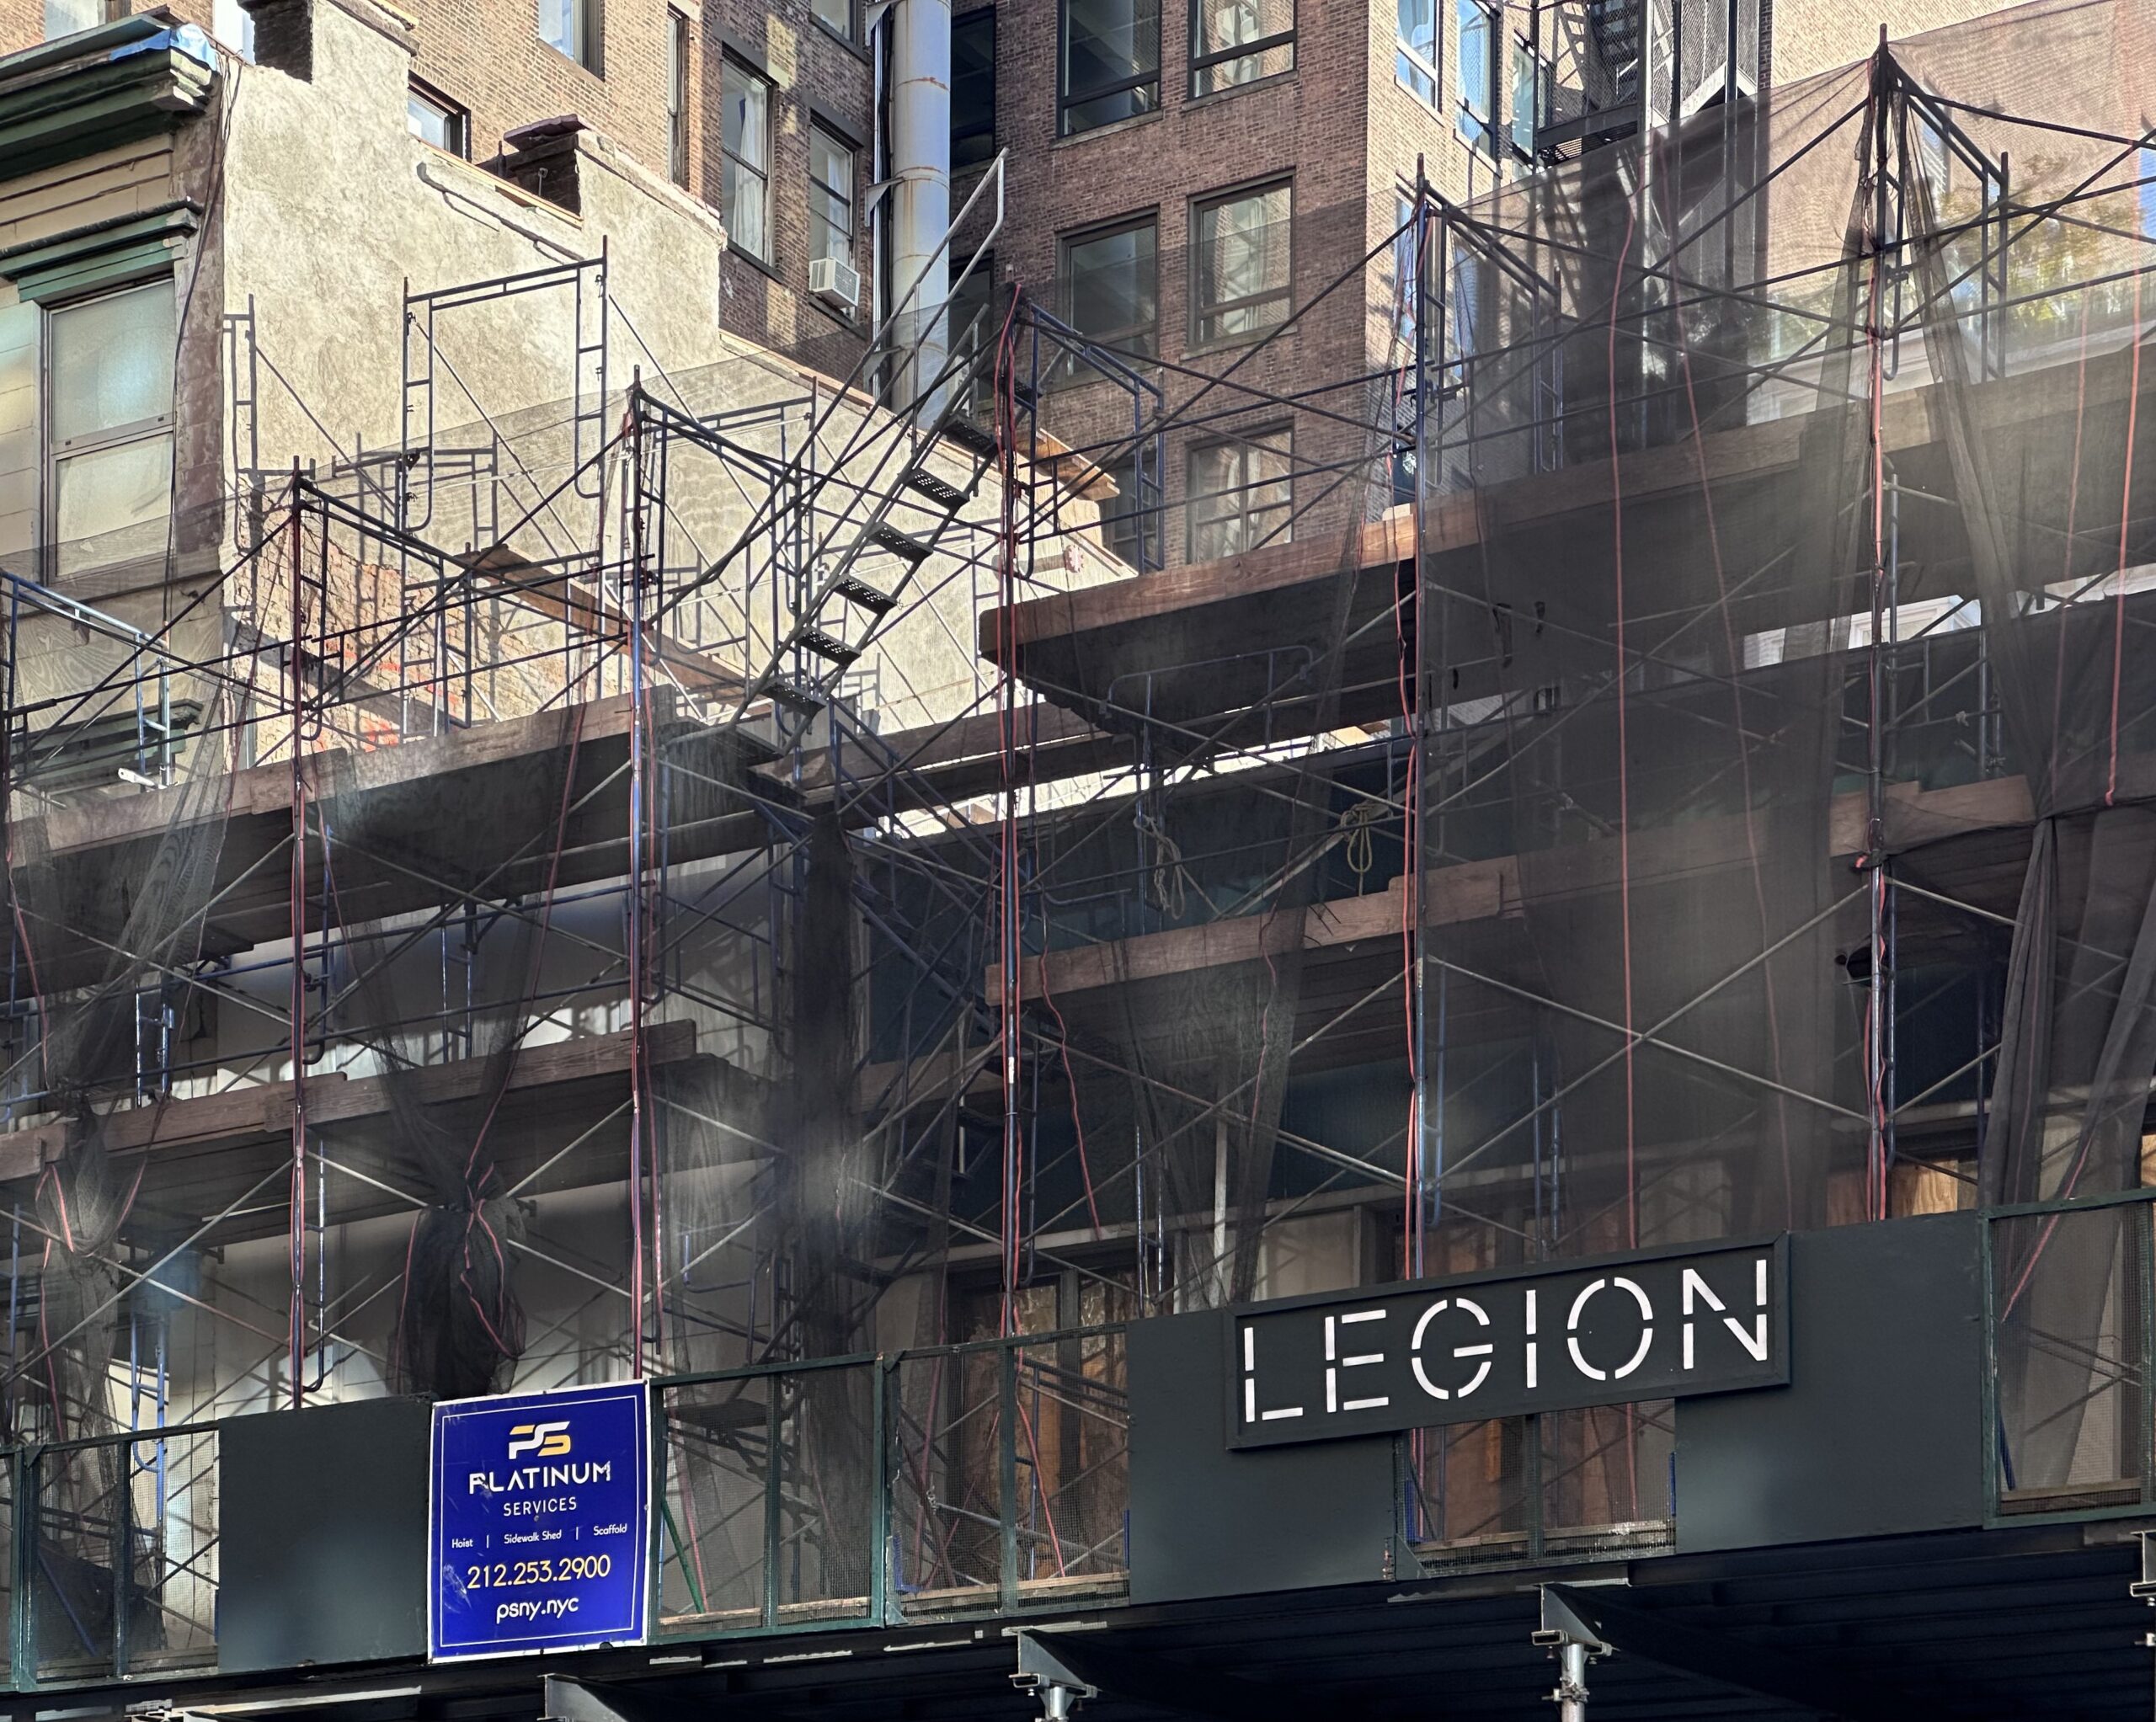
Most of the former six-story occupant of the site was razed since our last update in late April, when demolition preparations were just getting underway. Black netting and scaffolding shroud the remaining two stories of the midcentury structure, which should likely complete demolition before the end of the year.
5 West 13th Street. Photo by Michael Young.
5 West 13th Street. Photo by Michael Young.
5 West 13th Street. Photo by Michael Young.
5 West 13th Street. Photo by Michael Young.
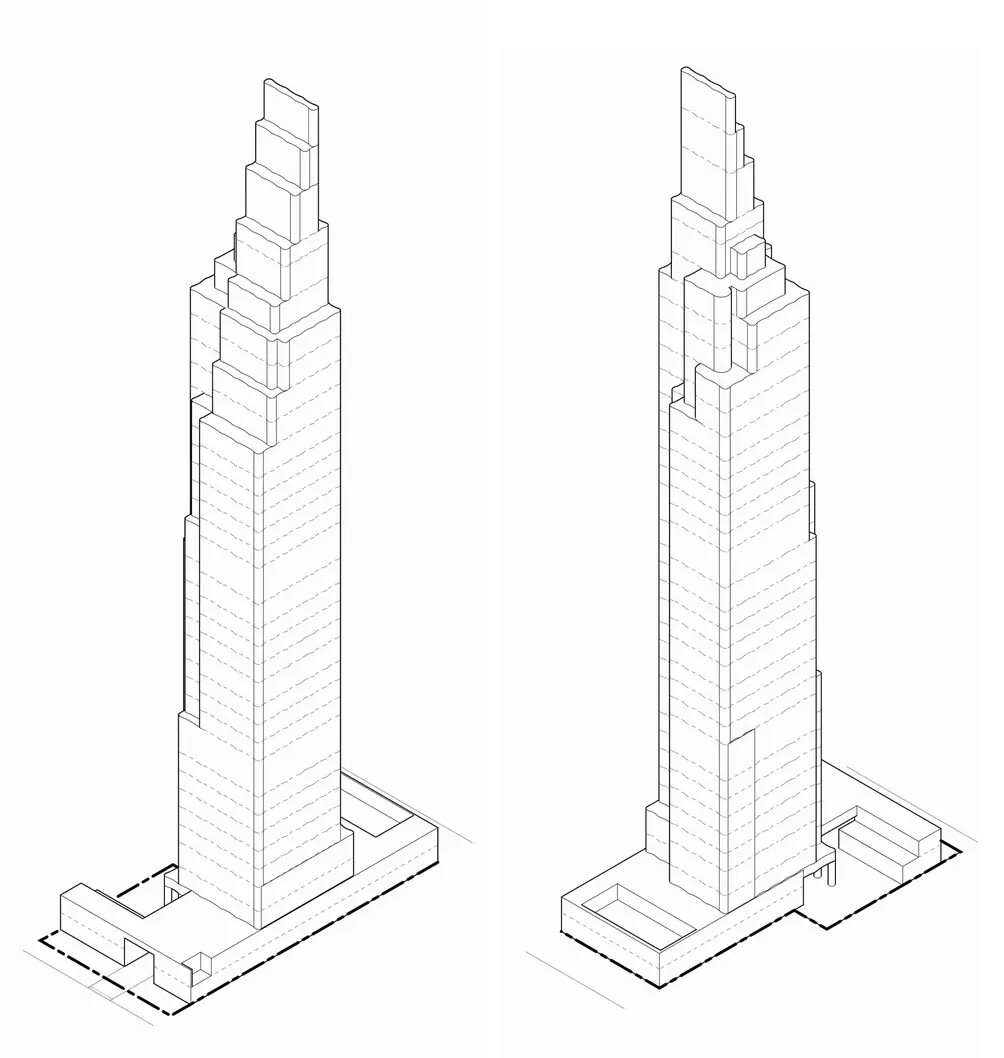
No renderings have been released for the project with the exception of the below axonometric diagrams first revealed on CityRealty in early August. The left diagram shows the southern profile facing West 13th Street, while the right shows the northern elevation along West 14th Street. The building begins with a two-story podium spanning the entire parcel, with a porte-cochère entrance along West 13th Street leading to a motor courtyard. A rectangular cutout is present on the opposite northern side of the podium roof, likely indicating the presence of a swimming pool.
The tower rises from the center of the lot with a fairly slender massing incorporating cutouts at the northeast and southwest corners. A handful of shallow setbacks are located within the corner cuts. A series of cascading setbacks begins at the 26th story, creating ample space for private terraces on the upper stories, and the building culminates in a tiered crown that steps upward to the south. Several double-height levels are indicated throughout the height of the skyscraper and will likely house mechanicals.
Possible façade materials remain unclear at the moment, but the diagrams do depict the exterior with an undulating geometry.
5 West 13th Street. Designed by Kohn Pedersen Fox.
Residential amenities will include a gym, swimming pool, golf simulator, pet grooming room, library and lounge, seven enclosed parking spaces, and bicycle storage.
The development site is located in close proximity to Union Square, providing convenient access to the 4, 5, 6, N, Q, R W, and L trains. Also nearby to the west are the F, M, and L trains at the 14th Street station along Sixth Avenue.
A construction timeline for 5 West 13th Street has yet to be announced.
Condo market faces a reckoning as the development pipeline has dried up
Sep 29, 2025, 10:09 AM EDT
By
Jade Indursky
Listen to this article
New York City’s new development market is facing a reckoning in 2026.
It’s not that demand has ground to a halt. A number of new buildings launched in the last year have sold quickly and with few discounts.
But the new buildings for buyers to tour in the back half of the year have all but disappeared in the proverbial fog of high financing costs and scarce assemblage opportunities, a trend that will only continue into next year, according to data shared from new development teams and analysts in the city.
In the second quarter of this year, the 3,600 unsold units in Manhattan marked a 10-year low, according to data from Corcoran Sunshine Marketing Group, and that number will only shrink heading into next year.
This year, only five more buildings are projected to deliver 245 units in Manhattan, according to data from Brown Harris Stevens Development Marketing.
“It’s surprising to me that it’s taken so long for so many people to actually catch on, because this has been in the making for quite some time,” said Corcoran Sunshine Marketing Group president Kelly Mack.
Caught between cycles
“In terms of actual inventory delivery to the market, you’re seeing a lull,” said Reuveni Development Marketing’s Daniel Pupke. “We’re in between two eras of cycles.”
The first was the post-pandemic boom that brought one of the best markets the city had seen in years. Buyers rushed into available buildings, while developers scooped up parcels with cheap financing.
“People bought and mobilized very quickly,” Pupke said, pointing out that many of those projects had seen success since coming to market in the last 18 months.
Take Avdoo’s 105-unit Boerum Hill project, Bergen. The firm acquired the site for $44 million at the end of 2021, and six months later had filed permits for the condo project. The project launched sales in the spring of last year and has been one of the best-selling condos in the city, with over 70 of its units sold.
But when interest rates rose heading into 2023, the first step of the development cycle was “essentially on pause unless you had a contract and financing,” Pupke said.
“The biggest factor in why we have less new projects today on the market is available equity,” said BHSDM managing director Robin Schneiderman. “That, to me, is what sort of drives the market overall.”
The equity dry spell went hand-in-hand with an increase in land prices, making ground-up developments more difficult to pencil, and the 2019 Housing Stability and Tenant Protection Act, which made it more difficult to convert rental buildings to condominiums.
From the midpoint of 2025 to the end of the year, only 1,450 units are expected to be delivered to the market, for a 29 percent decrease from its historic average. New development sales outpaced launches by 60 percent this year, according to Corcoran Sunshine.
Bright spots
Amid the downturn, the Upper East Side stands out. The neighborhood is expected to bring more units to the market through the end of 2026 than has historically been the case.
The largest launch there will be Related Companies’ 144-unit rental-to-condo conversion, The Strathmore, at 400 East 84th Street, which Corcoran Sunshine Marketing Group will be selling.
The project, which will have some units offered at under $1,800 per square foot, is also filling a gap in what Mack referred to as entry-level inventory.
“With new projects harder and more expensive to build and finance, most new projects are coming in at higher price points than we’ve historically seen,” she said, making the under $1,800 per square foot offerings “increasingly rare.” The average annual delivery of units in that price range will fall by over 60 percent through the end of 2026, according to data from Corcoran Sunshine.
Across the park, the Upper West Side is bereft of development opportunities, on track to exhaust its new development inventory as soon as 2027, according to Mack, with only 30 units expected to be released in the neighborhood through the end of 2026.
The only other development over 100 units with a planned sales launch this year is Rotem Rosen’s development at 126 East 57th Street on Billionaires’ Row, dubbed the Malabar Residences. The project, which is being sold by Douglas Elliman Development Marketing, recently lost its sales director when Noble Black departed for Corcoran last week.
“There’s some very high price profile, sort of exciting new developments are going to enter the market, but they’re going to be in the luxury category and the super luxury category,” Mack said.
One noteworthy market entrant will be the Brodsky Organization and Sorgente Group’s 38-unit conversion project at the Flatiron Building, where some onlookers have said prices could reach as high as $6,000 per square foot.
Grid Group’s boutique 22-unit Chelsea project at 142 West 21st Street will also launch sales this year, offering 16 parking spaces.
The two developments fit the mold of what’s coming to the market downtown, where buyer demand remains relentless: boutique, private and expensive. Projects like 140 Jane Street and The Katharine, which quickly sold seven of its 8 units after launching sales this spring, have laid out a playbook for developers that can find assemblages below 34th Street.
Larger projects expected to come to market next year include Elad Group’s condo conversion at 419 Park Avenue South and Continuum Company’s 137-unit development at 26 East 35th Street, according to data shared by Corcoran Sunshine.
Brooklyn is facing many of the same issues, albeit at a smaller scale. The nearly 1,000 units in the pipeline for next year are well above the yearly historical average of 535, according to data from BHSDM, but the average condo size is just 17 units, as many of the borough’s projects center on brownstone conversions or smaller ground-up developments.
Sales are expected to launch in the first quarter of next year at Charney Companies’ 182-unit project at 95 Rockwell Place in Fort Greene, according to a spokesperson for the project. Urban Development Partners will also be launching sales at a 71-unit project at 285 Schermerhorn Street this year in Downtown Brooklyn.
Looking ahead
The good news for developers is that any project coming online in the next several years will face limited competition.
“If you today presented a B+ or better site with views, you could be extremely successful if you deliver in three to five years,” Pupke said.
He added that the activity around projects has shifted and developers are buying again.
“You wouldn’t see action following the conversations that were happening,” he said of developers eying opportunities the last few years. “Speaking to the same groups, you’ll read three months later that the site closed.”
The paucity of sales launches is good news for projects with significant inventory still to move, like One Wall Street or The Greenwich, two condos in the Financial District with hundreds of units still to sell. In the last 12 months, The Greenwich has been the third-fastest-selling building in the city, according to Marketproof.
Still, new condos don’t pop up overnight, and Mack doesn’t see a quick fix on the horizon.
“It’s going to take at least five years to turn that picture around,” she said.
Editors note: This is the first all electric skyscraper in NYC.
7:30 am on August 28, 2025 By Max Gillespie
Alloy Development and The Vistria Group have closed on $535 million in capital for the construction of One Third Avenue, the second phase of the Alloy Block in Downtown Brooklyn. Designed to be the tallest Passive House building in the world at 730 feet, the 62-story mixed-use tower will deliver 583 market-rate and affordable housing units, retail, and office space. One Third Avenue follows 505 State Street, New York City’s first all-electric skyscraper, and 489 State Street, home to the city’s first Passive House public schools. The property is bounded by Flatbush Avenue to the north and east, State Street to the south, and 3rd Avenue to the west.
153 of One Third Avenue’s 583 units will be permanently affordable, with rents starting at $1,023 per month. The building’s six-floor podium will include 60,000 square feet of Class A office space, with residences spanning floors 11 to 60. Notably, the development integrates the adaptive reuse of two 19th-century structures along State and Schermerhorn Streets and introduces a new retail building along Third Avenue with 30,000 square feet of community-oriented retail space.
The project’s Passive House design includes an airtight building envelope, oversized operable windows for natural light, and filtered fresh air for improved indoor air quality. Residential and office components will share energy systems to reduce waste heat.
Nearby transit options include the A, C, G trains at the Hoyt–Schermerhorn Streets station; the 2, 3, 4, 5 trains at the Nevins Street station; and the B, D, N, Q, R, 2, 3, 4, and 5 trains and the LIRR at the Atlantic Avenue–Barclays Center transit hub.

 262 Fifth Avenue. Rendering courtesy of Hayes Davidson.


 168 Sip Avenue. Rendering courtesy of JLL.
 842 Sixth Avenue. Photo Michael Young.


 5 West 13th Street. Photo by Michael Young.


